Mass Transit Agency Fiscal Woes: Nine Tables and Charts
Many U.S. transit agencies are facing a similar problem: ridership far below pre-pandemic levels and revenues that are not keeping up with higher operating costs. The federal COVID-19 aid that helped bridge the gap has either run out or will soon be depleted.
Last fall, Illinois lawmakers raised taxes to pull Chicago’s transit agencies off their fiscal cliff. In New York, the state raised the payroll tax in 2023 to prevent severe cuts to New York City’s bus and train services.
But these fiscal pressures are not limited to the nation’s largest transit systems or to older cities with aging infrastructure. Similar challenges are affecting agencies across the country, including in faster growing regions that have expanded transit in recent decades.
Below, 9 charts and tables show how the same basic pattern is playing out in other cities: fewer transit riders, more people working from home, fare revenue that has not recovered, and operating costs that have continued to rise. The charts and tables focus on eight medium-sized metropolitan areas: the Regional Transportation District (Denver), TriMet (Portland), Charlotte Area Transit System, Utah Transit Authority (Salt Lake City), San Diego Metropolitan Transit System, Sacramento Regional Transit District, Capital Metro (Austin), and Metro Transit (Twin Cities of Minneapolis and St. Paul).
The most recently available information from the National Transit Database (NTD), U.S. Census Bureau’s American Community Survey, and transit agency documents was used to produce the tables and graphs. Unless otherwise noted, dollar figures are not adjusted for inflation.
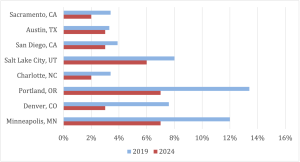
#1. Commuting by transit
In 2024, New York had the highest share of commuters using public transportation to get to work, at 49 percent, down from 56 percent in 2019. San Francisco had the second-highest share, at 25 percent, down from 36 percent in 2019. This graph shows the decrease in public transportation commute shares for the eight cities from 2019 to 2024.
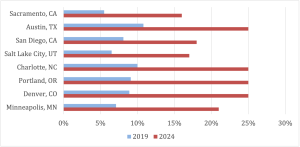
#2. Working from home
Changes in commute patterns are partially explained by the rise of telework since the pandemic. This graph shows the number of people working from home in the eight cities (in 2019 and 2024.)
#3. Transit Fares in 2019 and 2026
Transit agencies have not increased fares to keep up with inflation. Denver even reduced its base fare to address affordability. In the table below, the second column shows the base transit fare at the eight agencies in 2019. The third column shows what the fare would be today, if it increased at the rate of inflation. The column on the right shows the actual 2026 fare.
| 2019 fare | 2026 fares (if they had increased to account for inflation) | 2026 actual fare | |
| Minneapolis | $2.00 | $2.59 | $2.00 |
| Denver | $3.00 | $3.88 | $2.75 |
| Portland | $2.50 | $3.23 | $2.80 |
| Charlotte | $2.20 | $2.84 | $2.20 |
| Salt Lake | $2.50 | $3.23 | $2.50 |
| San Diego | $2.50 | $3.23 | $2.50 |
| Austin | $1.25 | $1.62 | $1.25 |
| Sacramento | $2.50 | $3.23 | $2.50 |
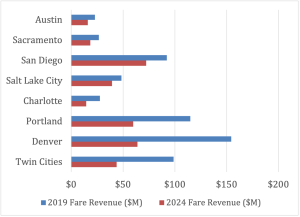
#4. Fare Revenue
This chart shows fare revenue (in millions of dollars) collected by the eight transit agencies in 2019 and 2024. Fare revenue decreased by more than half in four of the cities.
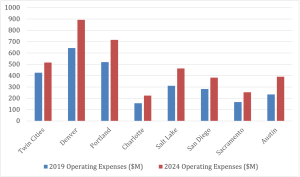
#5. Operating Expenses
This chart shows the transit agencies’ operating expenses in 2019 and 2024 (in millions of dollars). These expenses include bus, rail, and demand response services. At four of the eight agencies, expenses increased by more than 40%.
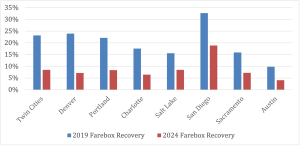
#6. Farebox Recovery Ratio
With fare revenue down from lower ridership and not keeping up with inflation, the impact on the farebox recovery ratio (i.e., fare revenue as a percentage of operating expenses) has been significant. If the ratio is 25 percent that means that the agency collects 25 cents in fares for every $1 it spends to provide service.
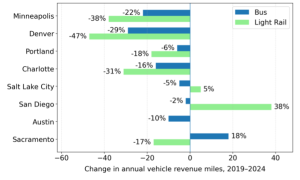
#7. Change in service
As a result of these financial pressures, many transit agencies have reduced bus and rail services since 2019. This chart shows the percentage change in revenue service miles between 2019 and 2024.
#8. Denver
For several years, the COVID relief bills provided operating assistance that was a critical backfill for many agencies as their operating revenues declined. This table shows the sources of revenue for the operating budget of the Regional Transportation District in Denver from 2015 to 2024, in thousands of dollars.
| Year | Operating Revenues | Sales/Use Tax | Grant Operating Assistance |
| 2015 | $125,877 | $541,518 | $73,383 |
| 2016 | $140,525 | $563,598 | $77,335 |
| 2017 | $147,376 | $598,187 | $80,412 |
| 2018 | $150,766 | $634,192 | $86,403 |
| 2019 | $160,943 | $659,418 | $86,263 |
| 2020 | $82,448 | $632,665 | $316,848 |
| 2021 | $83,120 | $756,974 | $299,052 |
| 2022 | $77,999 | $855,146 | $307,042 |
| 2023 | $65,053 | $858,133 | $234,488 |
| 2024 | $65,438 | $857,411 | $52,951 |
#9. Shifting Funds in Philadelphia
Some agencies are taking risky strategies to plug their deficits. Philadelphia offers a cautionary example. The Southeastern Pennsylvania Transportation Authority (SEPTA) is using funds that it had set aside for its capital program to avert draconian cuts. That will impact its plans to upgrade and replace its aging infrastructure.
| Number of bridges SEPTA owns | 350 bridges |
| When many of these bridges were built | Late 1800s and early 1900s |
| Average age of SEPTA’s commuter rail cars | 35.4 |
| Average age of SEPTA’s heavy rail cars | 32.7 |
| Average age of SEPTA’s street cars | 45.3 |
For more ETW articles about the transit fiscal cliff, see:
Halloween Rescue: Illinois Pulls Chicago Transit Agencies Off the Fiscal Cliff (October 2025)
Public Transit Systems on the Edge of a Cliff Amid Funding Shortfalls (September 2025)
Drama in Chicago and Philadelphia: The Transit Fiscal Cliff Has Arrived (June 2025)
Are Transportation Agencies Taking on Too Much Debt? (February 2024)
WMATA Releases Its “Fiscal Cliff” Doomsday Budget (December 2023)
Webinar: Climbing Down From The Fiscal Cliff: Lessons From Transit Advocates (November 2023)
Chicago: Tackling the Fiscal Cliff and Addressing Governance Issues (October 2023)
WMATA Reveals Plans for Fiscal Cliff Doomsday Budget One Year from Now (June 2023)
New NYC Transit Forecast Previews “Fiscal Cliff” Issues (December 2022)
Looking to the Horizon: How Agencies are Anticipating the Mass Transit Fiscal Cliff (November 2022)
The Mass Transit Fiscal Cliff: Estimating the Size and Scope of the Problem (September 2022)

