Opinion: Is “Fix-It-First” Compatible With Promoting “Equity”?
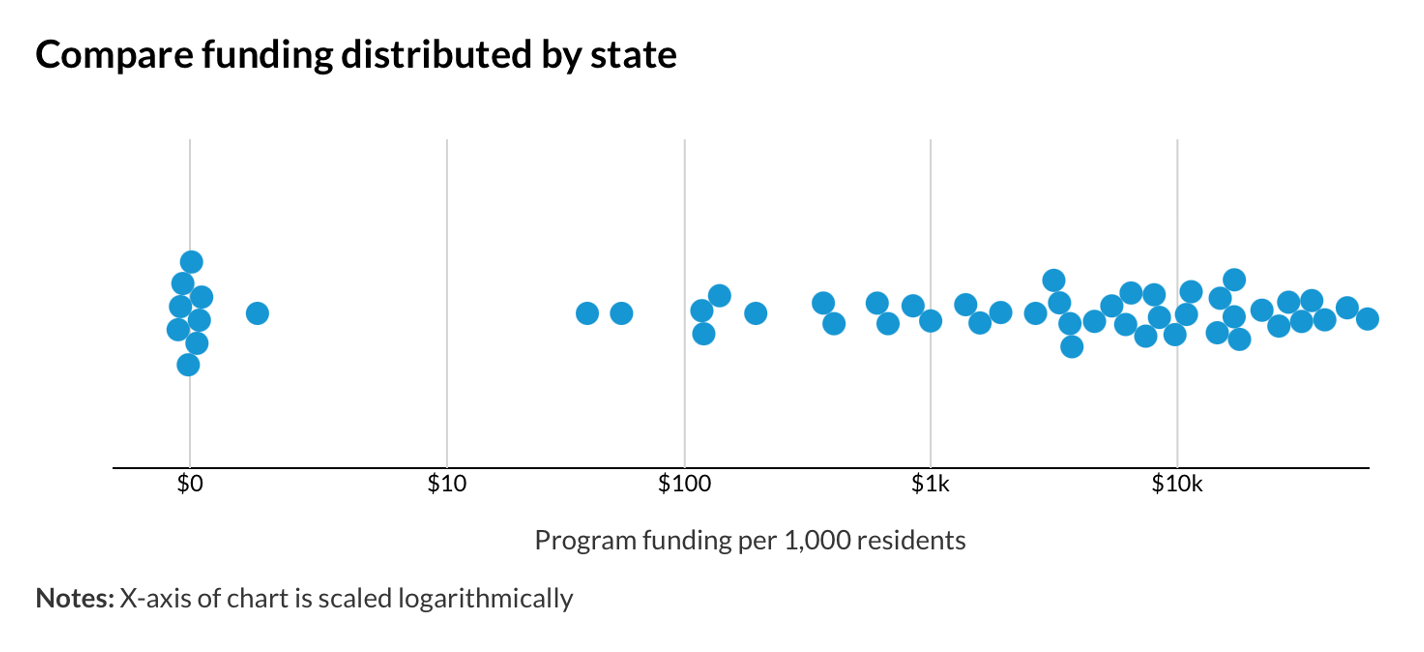
Two weeks ago, the Urban Institute released a new research report entitled “Is Federal Infrastructure Investment Advancing Equity Goals?” The report, as well as an accompanying interactive data display, attempts to “examine how infrastructure funds are being apportioned to understand whether investments are expanding support for disinvested communities or, in contrast, reinforcing historic inequities.”
The report examined the fiscal year 2022 distribution of funds from 66 grant programs funded either through the Infrastructure Investment and Jobs Act (IIJA) or through the Department of Housing and Urban Development, and analyzed this funding distribution (for both formula-based and competitive grant programs) through a variety of criteria for “distributional equity” (fairness in outcome), with an emphasis on location-based racial and economic demographics.
With regard to highway formula funding, the Urban report’s conclusion is “Federal investments in roadways, broadband, and water distributed through formula programs tend to disproportionately benefit states with lower shares of people of color because of their emphasis on providing minimum funding to states with low populations and providing substantial support to states with more roads. The result is a doubling down on existing inequitable patterns of infrastructure investment. This is a concern for highway funding especially, given that most federal road funding can be leveraged for other uses, such as public transportation or pedestrian and bicycling projects; states with a higher share of people of color are missing out on a fair share of funding that they can use for the transportation investments of their choice.”
But implicit in the Urban report there lies a broader lesson.
Since the beginning of the Biden Administration, Transportation Secretary Buttigieg and other leaders have promoted a “Fix-it-First” approach to infrastructure funding. This is another way of saying that the Administration wants to prioritize projects that keep existing transportation assets in a state of good repair (SOGR) ahead of projects that build new assets – the broad theme of fixing the existing “crumbling infrastructure” before going on to build shiny new infrastructure.
The problem, which becomes more obvious the deeper you dig into Urban’s database, is this: the Fix-it-First, SOGR-prioritizing approach is fundamentally incompatible with promoting distributional equity from these programs, particularly for programs dealing with a connected national transportation system.
A lot of decisions went into picking the location for a transportation asset, designing the asset, constructing the asset, and determining how much or how little to maintain that asset over the decades. Once you decide to make SOGR of existing assets the focus of a program, all of those decisions get baked into the cake and you have to maintain those assets, no matter how fairly or unfairly they were originally distributed, and no matter in whose community the assets are currently located.
A hypothetical: suppose that a rockslide were to destroy a good-sized segment of Interstate 70 in the mountains near Vail, Colorado, rendering the road impassable. Reconstructing that part of I-70 would immediately become Colorado DOT’s top priority, and one of USDOT’s top priorities, notwithstanding the fact that Vail is notoriously high-income and predominantly comprises white residents. The distributional equity of giving a lot of money to the Vail area is irrelevant in this context, because the Interstate is a nationally connected system, and if you don’t fix the missing link of I-70 there, you can no longer get from Maryland to the Pacific Coast states that way.
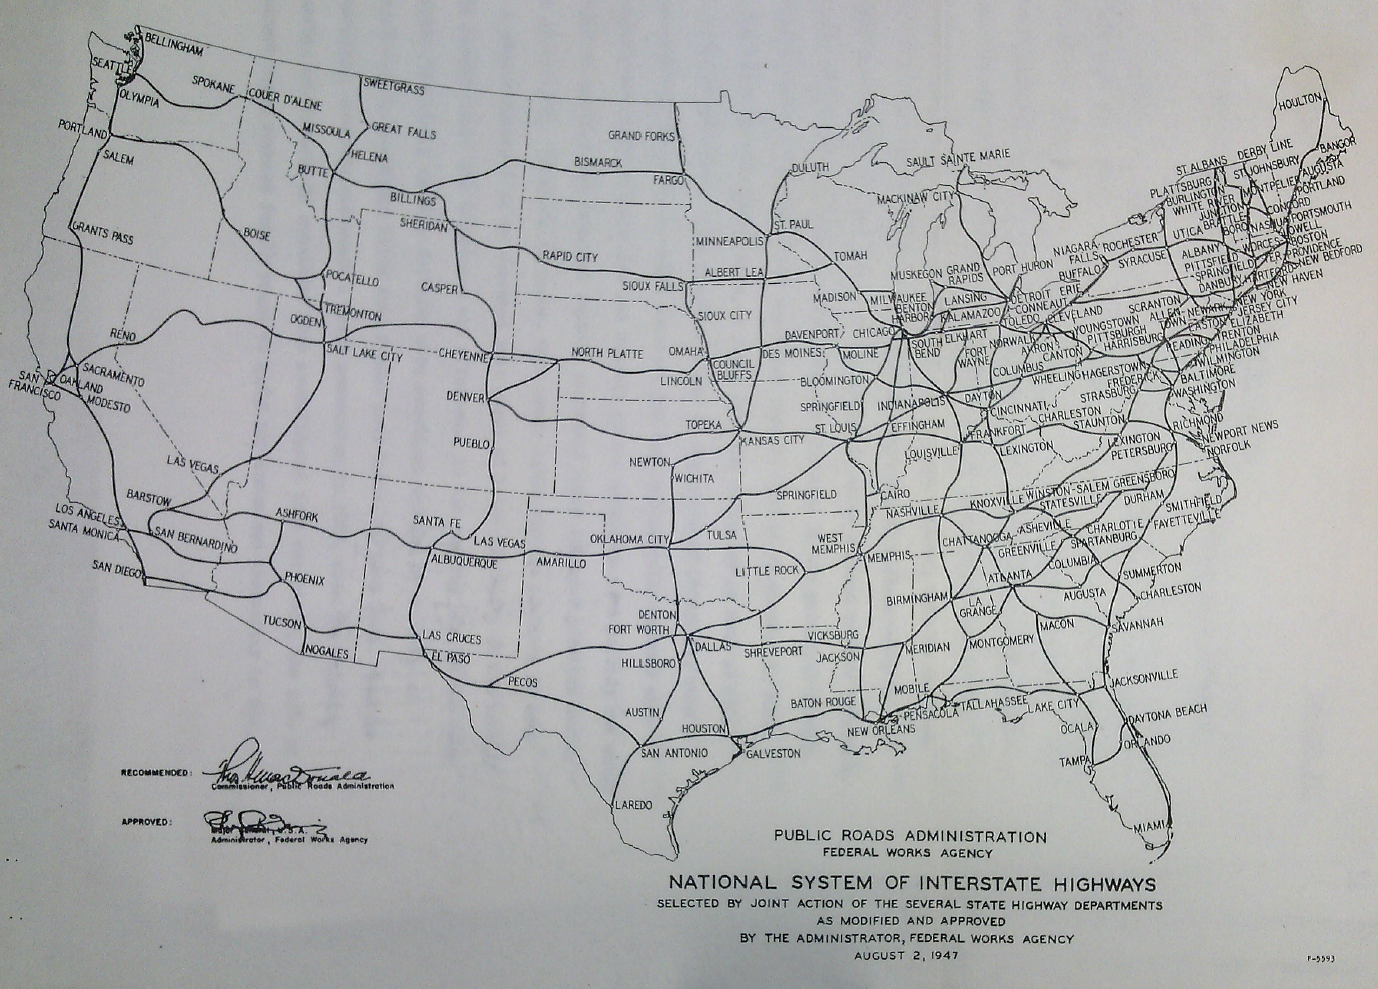
The impossibility of any kind of real per-capita equity when distributing funding for a connected national transportation system has been apparent from the beginning. One glance at the original map of the proposed Interstate system, agreed to in 1947 but not funded significantly until 1956, made it obvious even to the lowest of the low-information voter: the Eastern, Southeastern, Midwest, and Pacific states were going to have to subsidize construction in the low-population Great Plains and Rocky Mountain states, because otherwise, those states could never afford to build their share of the roads necessary for a connected national system of East to West and North to South roads.
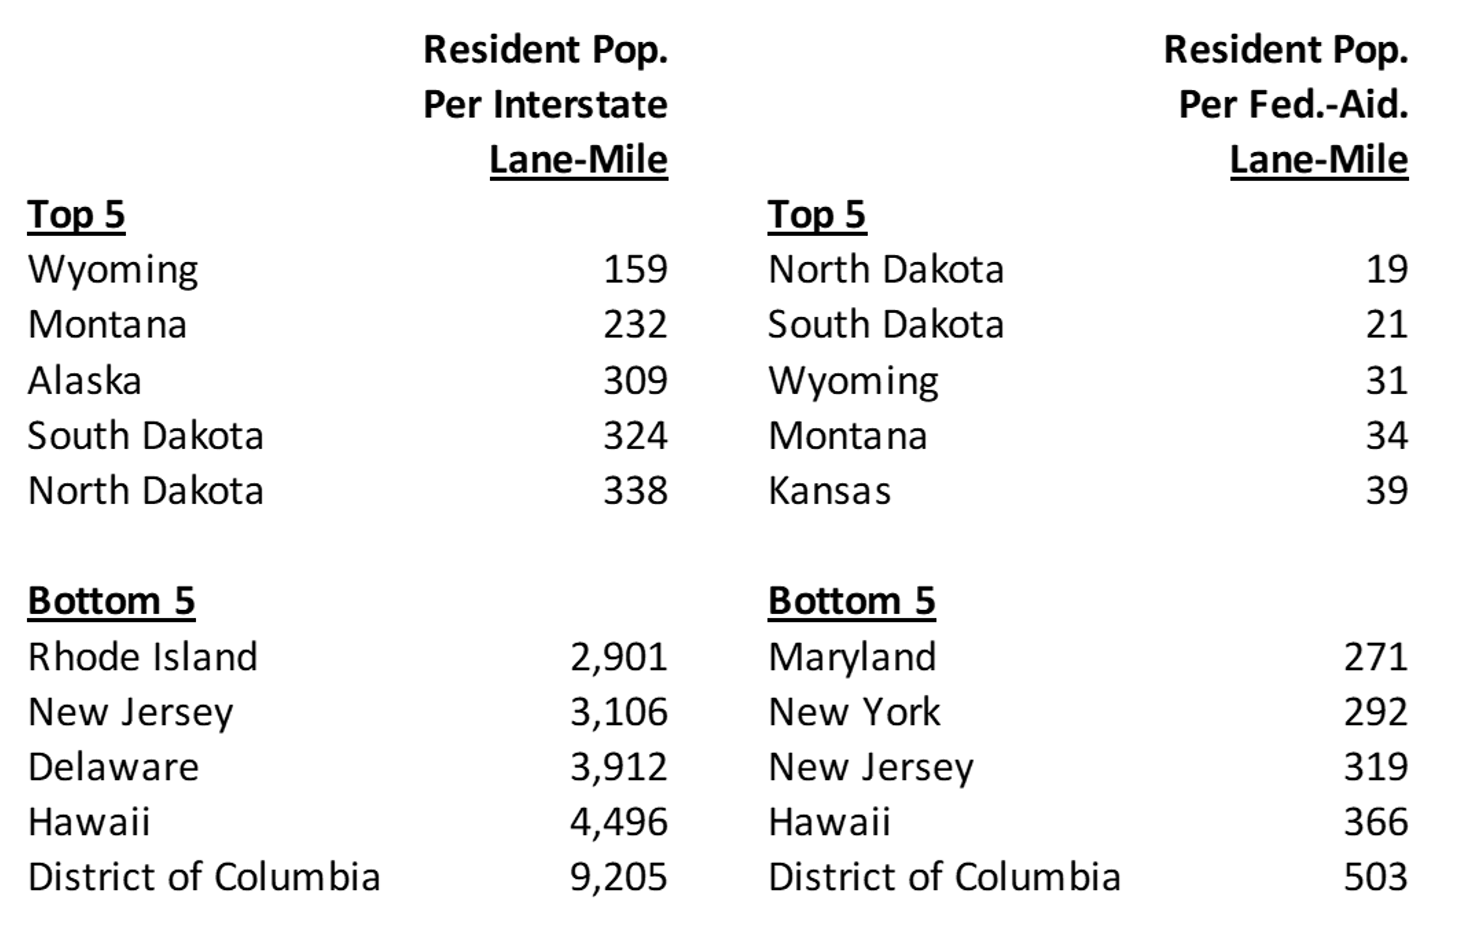
On a per capita basis using 2021 numbers and population estimates, Wyoming has almost 25 times more Interstate lane-miles per capita than does Delaware. Looking at the broader federal-aid highway system (of which the Interstate is a subset), North Dakota has 16.7 times as many federal-aid lane-miles per capita as does New Jersey. Funding under any kind of SOGR-focused highway program has to go where the roads already are, no matter who lives there. The table below shows the highs and lows, transposed into people per mile instead of miles per person so the numbers would be greater than zero instead of less than zero.
The history of who settled the Great Plains and Rocky Mountain states, and when they did it, is also responsible for some of the racial per-capita inequities that the Urban report shows from highway formula funding. (The Urban report does note that the exception to this rule is the racial minority group that is most over-represented in the Great Plains and Rocky Mountain states versus their presence in most of the rest of the country – Indian tribes.)
When it comes to highways, there is one presentational flaw in the Urban report. The report analyzes each of the eight highway programs apportioned by formula pursuant to 23 U.S.C. 104 and gives the impression that each has a different formula. That is untrue. All federal-aid highway formula funding from the Highway Trust Fund goes to states under one big formula. The national formula total is divided 51 ways (states plus DC), based on the FY 2009 formula apportionments (which were based on FY 2007 real-world data), plus each state’s share of SAFETEA-LU earmarks, as modified several times from 2010-2021 so Texas could get a 95 percent rate of return on its Highway Account excise tax payments. That’s it, and that’s the reason why these programs tend to score the same on Urban’s equity metrics.
Once a state gets its total funding for the year, Congestion Mitigation and Air Quality funding and Metropolitan Planning funding are taken off the top at fixed national totals in whatever share of that state’s funding went to those programs in FY 2009 (as adjusted as noted above). Next, the National Highway Freight Program is taken off the top at a fixed national total in the state’s share of total formula funding, and then each state’s remainder is split: 59.1 percent National Highway Performance Program, 28.7 percent Surface Transportation Block Grant Program, 6.7 percent Highway Safety Improvement Program, 2.6 percent Carbon Reduction Program, and 2.9 percent PROTECT Formula Program.
That FY 2009 total was based on a lot of different formula programs in effect for that year, back when the formulae made some kind of sense, with a lot of factors (state lane-miles, state population, state VMT, state fuel tax payments, state safety record, bridge replacement costs, state share of population-weighted urban areas with bad air quality, etc.) as they existed in 2007. (See Appendix D of this FHWA document for a list of the old formulae.)
Trust Fund formula funding is stuck in the mid-2000s and has become wholly political. But the IIJA created several new General Fund formula programs that gave the Appropriations Committees the opportunity to write their own formulae, and in one case they did so, for the new Bridge Formula Program. That formula has nothing to do with any of the 20th century formula political drama. Instead, the money is apportioned to states based on two needs-based criteria:
- 75 percent of the money is distributed based on each state’s share of the estimated cost to replace all U.S. highway bridges rated in poor condition.
- 25 percent of the money is distributed based on each state’s share of the estimated cost to repair all U.S. highway bridges rated in fair condition.
That’s it. Notice that the formula says not a word about people (though there is a $45 million state minimum apportionment for some kind of geographic equity). It’s all about infrastructure assets. So the bridge program scores notably worse on Urban’s poverty rate and median income equity metrics than does the main highway formula and its programs.
But the best example is in mass transit, which has an explicit State of Good Repair program. 97.15 percent of that money is based on a formula that is 50 percent the pre-2012 “fixed guideway modernization” formula (which was obviously political but was roughly based on the extent of the existing rail transit infrastructure – see here), 30 percent transit vehicle revenue miles, and 20 percent transit route miles.
The transit SOGR formula scores significantly worse than the highway formulae do on Urban’s High-Need Equity Measures, which Urban defined as “whether funding is correlated with state or county characteristics for the jurisdictions with the highest share of people of color, households with low incomes, or disproportionate programmatic need.” Ranges to from 1.0 to -1.0. At zero, per capita funding distribution syncs perfectly the characteristic being measured, and the more negative a number is, the more the per capita distribution of the money diverges from what Urban defines as an equitable distribution – see pages 15-17 of their report for more details.
| Urban Institute High-Need Equity Measures | ||
| Highway | Transit | |
| NHPP | SOGR | |
| People of color | -0.41 | -0.69 |
| Poverty rate | -0.25 | -0.73 |
| Pop density | -0.38 | -0.63 |
| median income | -0.17 | -0.74 |
And, needless to say, because existing mass transit fixed guideway infrastructure and ridership are not distributed nearly as widely throughout the 50 states as highways are, the transit SOGR formula is a dismal failure on regional equity, with 21 states receiving $1 or less per capita from the program and New Yorkers receiving $58.45 per capita. Only 85 urban areas have fixed guideway transit and are eligible (see list here).
(I’m not saying that distribution is unfair, I am saying that looking at state-of-good-repair-focused infrastructure programs through an equity lens on any kind of per-capita basis is the wrong way to go.)
Prioritization of bringing existing infrastructure assets to a state of good repair, particularly for nationally connected networks, is a worthwhile national policy goal. And promotion of distributional equity among disadvantaged populations, measured per capita, can also be a worthwhile national policy goal. But the two goals are very difficult to achieve in the same program, particularly one that is formula-driven.
(The opinions expressed above are those of the author and do not necessarily reflect the views of the Eno Center for Transportation.)
Search Eno Transportation Weekly
Happening on the Hill
Tags
Related Articles
 https://enotrans.org/wp-content/uploads/2026/07/a-boat.jpg
1499
2000
Grace Truslow
https://enotrans.org/wp-content/uploads/2022/12/Eno-Logo-2.png
Grace Truslow2026-07-24 15:34:312026-07-24 15:37:49House Roundtable on Balancing US Maritime Competitiveness and Safety Goals
https://enotrans.org/wp-content/uploads/2026/07/a-boat.jpg
1499
2000
Grace Truslow
https://enotrans.org/wp-content/uploads/2022/12/Eno-Logo-2.png
Grace Truslow2026-07-24 15:34:312026-07-24 15:37:49House Roundtable on Balancing US Maritime Competitiveness and Safety Goals https://enotrans.org/wp-content/uploads/2026/02/Shipbuilding.jpg
1500
2000
Sohail Husain
https://enotrans.org/wp-content/uploads/2022/12/Eno-Logo-2.png
Sohail Husain2026-07-24 15:32:302026-07-24 15:32:30House Foreign Affairs Committee Meets to Discuss US Shipbuilding and Concerns over China
https://enotrans.org/wp-content/uploads/2026/02/Shipbuilding.jpg
1500
2000
Sohail Husain
https://enotrans.org/wp-content/uploads/2022/12/Eno-Logo-2.png
Sohail Husain2026-07-24 15:32:302026-07-24 15:32:30House Foreign Affairs Committee Meets to Discuss US Shipbuilding and Concerns over China https://enotrans.org/wp-content/uploads/2026/04/maritime-boat-freight-port-ship.jpg
1499
2000
Grace Truslow
https://enotrans.org/wp-content/uploads/2022/12/Eno-Logo-2.png
Grace Truslow2026-04-24 14:14:132026-04-24 14:57:52House Armed Services and T&I Members Discuss Upstream Efforts to Revitalize Maritime Industrial Base
https://enotrans.org/wp-content/uploads/2026/04/maritime-boat-freight-port-ship.jpg
1499
2000
Grace Truslow
https://enotrans.org/wp-content/uploads/2022/12/Eno-Logo-2.png
Grace Truslow2026-04-24 14:14:132026-04-24 14:57:52House Armed Services and T&I Members Discuss Upstream Efforts to Revitalize Maritime Industrial Base https://enotrans.org/wp-content/uploads/2025/09/Maritime-Fuel-scaled.jpg
1440
2560
Rebecca Higgins
https://enotrans.org/wp-content/uploads/2022/12/Eno-Logo-2.png
Rebecca Higgins2026-04-10 15:09:542026-04-10 15:09:54The Legal Question of Tolling Hormuz
https://enotrans.org/wp-content/uploads/2025/09/Maritime-Fuel-scaled.jpg
1440
2560
Rebecca Higgins
https://enotrans.org/wp-content/uploads/2022/12/Eno-Logo-2.png
Rebecca Higgins2026-04-10 15:09:542026-04-10 15:09:54The Legal Question of Tolling Hormuz https://enotrans.org/wp-content/uploads/2026/03/Debra-Calhoun-lg-header.png
500
2096
Rebecca Higgins
https://enotrans.org/wp-content/uploads/2022/12/Eno-Logo-2.png
Rebecca Higgins2026-03-31 13:28:382026-03-31 15:20:23Making More Visible the Often-Invisible Inland Waterways
https://enotrans.org/wp-content/uploads/2026/03/Debra-Calhoun-lg-header.png
500
2096
Rebecca Higgins
https://enotrans.org/wp-content/uploads/2022/12/Eno-Logo-2.png
Rebecca Higgins2026-03-31 13:28:382026-03-31 15:20:23Making More Visible the Often-Invisible Inland Waterways https://enotrans.org/wp-content/uploads/2026/02/a-boat.jpg
1499
2000
Sohail Husain
https://enotrans.org/wp-content/uploads/2022/12/Eno-Logo-2.png
Sohail Husain2026-03-20 12:41:262026-03-20 12:41:26House Judiciary Committee Meets to Discuss Antitrust Exemption in Maritime Shipping
https://enotrans.org/wp-content/uploads/2026/02/a-boat.jpg
1499
2000
Sohail Husain
https://enotrans.org/wp-content/uploads/2022/12/Eno-Logo-2.png
Sohail Husain2026-03-20 12:41:262026-03-20 12:41:26House Judiciary Committee Meets to Discuss Antitrust Exemption in Maritime Shipping https://enotrans.org/wp-content/uploads/2026/03/Screenshot-2026-03-06-133311.png
595
709
Rebecca Higgins
https://enotrans.org/wp-content/uploads/2022/12/Eno-Logo-2.png
Rebecca Higgins2026-03-06 15:30:262026-03-06 15:30:26Tracking Transportation Impacts from Military Engagement in Iran
https://enotrans.org/wp-content/uploads/2026/02/Shipbuilding.jpg
1500
2000
kferrell
https://enotrans.org/wp-content/uploads/2022/12/Eno-Logo-2.png
kferrell2026-02-20 15:27:242026-02-20 15:27:24Trump Envisions “Maritime Golden Age” through Investments, Fees, and Deregulation
https://enotrans.org/wp-content/uploads/2026/03/Screenshot-2026-03-06-133311.png
595
709
Rebecca Higgins
https://enotrans.org/wp-content/uploads/2022/12/Eno-Logo-2.png
Rebecca Higgins2026-03-06 15:30:262026-03-06 15:30:26Tracking Transportation Impacts from Military Engagement in Iran
https://enotrans.org/wp-content/uploads/2026/02/Shipbuilding.jpg
1500
2000
kferrell
https://enotrans.org/wp-content/uploads/2022/12/Eno-Logo-2.png
kferrell2026-02-20 15:27:242026-02-20 15:27:24Trump Envisions “Maritime Golden Age” through Investments, Fees, and Deregulation https://enotrans.org/wp-content/uploads/2025/12/Coast-Guard.jpg
1414
2121
kferrell
https://enotrans.org/wp-content/uploads/2022/12/Eno-Logo-2.png
kferrell2025-12-19 14:59:172025-12-19 15:48:29The Coast Guard’s Ongoing Experience with New Technology
https://enotrans.org/wp-content/uploads/2025/12/Coast-Guard.jpg
1414
2121
kferrell
https://enotrans.org/wp-content/uploads/2022/12/Eno-Logo-2.png
kferrell2025-12-19 14:59:172025-12-19 15:48:29The Coast Guard’s Ongoing Experience with New Technology https://enotrans.org/wp-content/uploads/2025/10/maritime.jpg
1498
2000
kferrell
https://enotrans.org/wp-content/uploads/2022/12/Eno-Logo-2.png
kferrell2025-10-24 15:18:312025-10-24 16:18:01Senate Commerce Committee Holds Hearing on Maritime-Related nominations
https://enotrans.org/wp-content/uploads/2025/09/Maritime-Fuel-scaled.jpg
1440
2560
kferrell
https://enotrans.org/wp-content/uploads/2022/12/Eno-Logo-2.png
kferrell2025-09-12 16:10:312025-09-12 16:10:31Maritime Decarbonization – US Moves Pale Next to IMO’s
https://enotrans.org/wp-content/uploads/2025/10/maritime.jpg
1498
2000
kferrell
https://enotrans.org/wp-content/uploads/2022/12/Eno-Logo-2.png
kferrell2025-10-24 15:18:312025-10-24 16:18:01Senate Commerce Committee Holds Hearing on Maritime-Related nominations
https://enotrans.org/wp-content/uploads/2025/09/Maritime-Fuel-scaled.jpg
1440
2560
kferrell
https://enotrans.org/wp-content/uploads/2022/12/Eno-Logo-2.png
kferrell2025-09-12 16:10:312025-09-12 16:10:31Maritime Decarbonization – US Moves Pale Next to IMO’s https://enotrans.org/wp-content/uploads/2025/05/cargo-theft-scaled.jpg
1707
2560
kferrell
https://enotrans.org/wp-content/uploads/2022/12/Eno-Logo-2.png
kferrell2025-05-02 14:42:202025-05-02 16:00:17Roundtable: Combatting Cargo Theft: Stakeholder Perspectives
https://enotrans.org/wp-content/uploads/2025/05/cargo-theft-scaled.jpg
1707
2560
kferrell
https://enotrans.org/wp-content/uploads/2022/12/Eno-Logo-2.png
kferrell2025-05-02 14:42:202025-05-02 16:00:17Roundtable: Combatting Cargo Theft: Stakeholder Perspectives 
