Highway Construction Costs Dropped 1.1% in Oct-Dec 2022 Quarter
After almost two years of explosive growth, the Federal Highway Administration’s metric of highway construction costs dipped in the fourth quarter of calendar year 2022 according to data released today.
FWHA’s National Highway Construction Cost Index (NHCCI) dropped to 2.763, a 1.1 percent drop from the all-time high in the previous quarter. However, costs are still up 48.5 percent from the level in the October-December 2020 quarter (when the NHCCI was just 1.860).
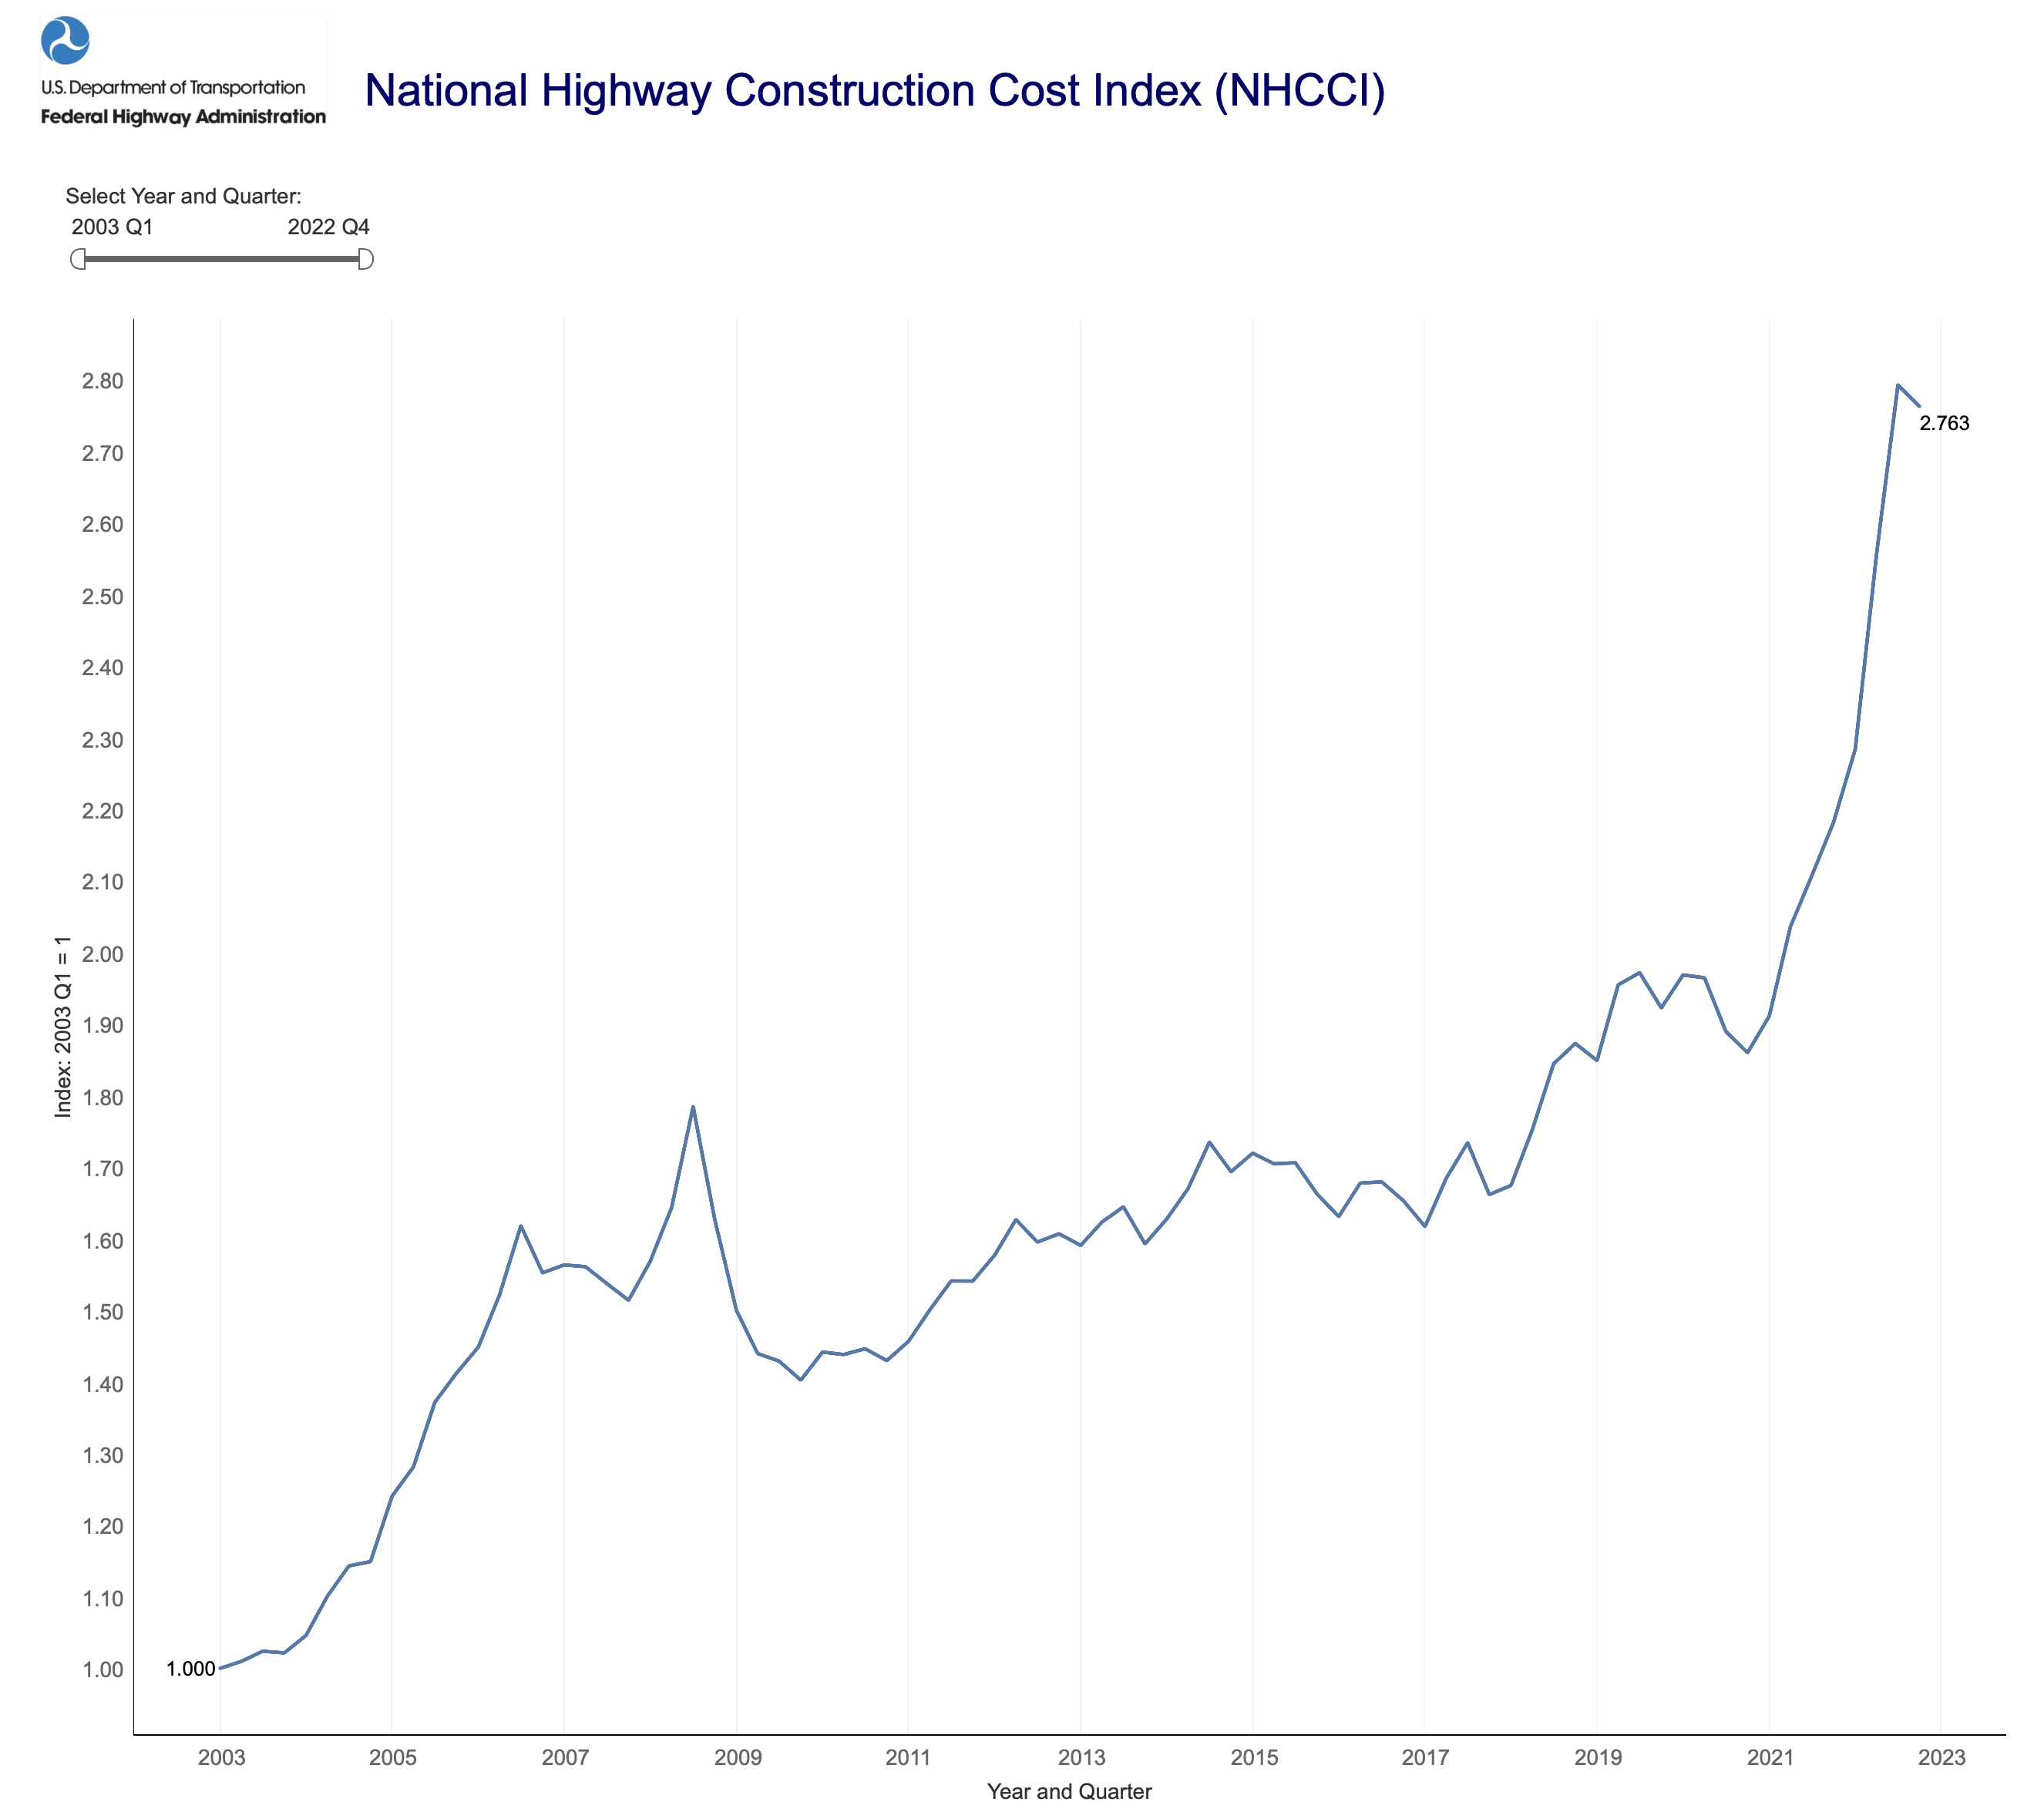
Digging into the data, a 3.1 percent drop in the cost of asphalt (due to declining oil prices) was somewhat offset by a 2.4 percent increase in the cost of grading and excavation (which is one of the more labor-intensive cost sectors, in a very tight job market).
By our reckoning, the result of the highway construction cost inflation in 2022 and 2023 has been to devalue the construction dollar to the point that FHWA has lost $24.1 billion in buying power, as shown in the calculations below. Obligation data is from usaspending.gov.
Total FHWA Obligations (Excluding Emergency Relief) |
||||||
| Nominal | NHCCI | “Real” | Real Are | |||
| Obligations | NHCCI | Rebased to | Obligations | Less Than | ||
| Million $ | Actual | FY21 Q1 | Million $ | Nominal by: | ||
| FY21 Q1 | 4,506 | 1.8601 | 1.0000 | 4,506 | 0 | |
| FY21 Q2 | 9,859 | 1.9112 | 1.0274 | 9,596 | -263 | |
| FY21 Q3 | 14,775 | 2.0363 | 1.0947 | 13,497 | -1,278 | |
| FY21 Q4 | 23,238 | 2.1075 | 1.1330 | 20,510 | -2,728 | |
| FY22 Q1 | 3,628 | 2.1821 | 1.1731 | 3,093 | -535 | |
| FY22 Q2 | 8,490 | 2.2841 | 1.2279 | 6,914 | -1,576 | |
| FY22 Q3 | 19,301 | 2.5555 | 1.3738 | 14,049 | -5,252 | |
| FY22 Q4 | 31,279 | 2.7930 | 1.5015 | 20,832 | -10,447 | |
| FY23 Q1 | 6,175 | 2.7628 | 1.4853 | 4,157 | -2,018 | |
| TOTAL | 121,252 | 97,154 | -24,098 | |||
Search Eno Transportation Weekly
Happening on the Hill
Tags
Related Articles
 https://enotrans.org/wp-content/uploads/2026/07/a-boat.jpg
1499
2000
Grace Truslow
https://enotrans.org/wp-content/uploads/2022/12/Eno-Logo-2.png
Grace Truslow2026-07-24 15:34:312026-07-24 15:37:49House Roundtable on Balancing US Maritime Competitiveness and Safety Goals
https://enotrans.org/wp-content/uploads/2026/07/a-boat.jpg
1499
2000
Grace Truslow
https://enotrans.org/wp-content/uploads/2022/12/Eno-Logo-2.png
Grace Truslow2026-07-24 15:34:312026-07-24 15:37:49House Roundtable on Balancing US Maritime Competitiveness and Safety Goals https://enotrans.org/wp-content/uploads/2026/02/Shipbuilding.jpg
1500
2000
Sohail Husain
https://enotrans.org/wp-content/uploads/2022/12/Eno-Logo-2.png
Sohail Husain2026-07-24 15:32:302026-07-24 15:32:30House Foreign Affairs Committee Meets to Discuss US Shipbuilding and Concerns over China
https://enotrans.org/wp-content/uploads/2026/02/Shipbuilding.jpg
1500
2000
Sohail Husain
https://enotrans.org/wp-content/uploads/2022/12/Eno-Logo-2.png
Sohail Husain2026-07-24 15:32:302026-07-24 15:32:30House Foreign Affairs Committee Meets to Discuss US Shipbuilding and Concerns over China https://enotrans.org/wp-content/uploads/2026/04/maritime-boat-freight-port-ship.jpg
1499
2000
Grace Truslow
https://enotrans.org/wp-content/uploads/2022/12/Eno-Logo-2.png
Grace Truslow2026-04-24 14:14:132026-04-24 14:57:52House Armed Services and T&I Members Discuss Upstream Efforts to Revitalize Maritime Industrial Base
https://enotrans.org/wp-content/uploads/2026/04/maritime-boat-freight-port-ship.jpg
1499
2000
Grace Truslow
https://enotrans.org/wp-content/uploads/2022/12/Eno-Logo-2.png
Grace Truslow2026-04-24 14:14:132026-04-24 14:57:52House Armed Services and T&I Members Discuss Upstream Efforts to Revitalize Maritime Industrial Base https://enotrans.org/wp-content/uploads/2025/09/Maritime-Fuel-scaled.jpg
1440
2560
Rebecca Higgins
https://enotrans.org/wp-content/uploads/2022/12/Eno-Logo-2.png
Rebecca Higgins2026-04-10 15:09:542026-04-10 15:09:54The Legal Question of Tolling Hormuz
https://enotrans.org/wp-content/uploads/2025/09/Maritime-Fuel-scaled.jpg
1440
2560
Rebecca Higgins
https://enotrans.org/wp-content/uploads/2022/12/Eno-Logo-2.png
Rebecca Higgins2026-04-10 15:09:542026-04-10 15:09:54The Legal Question of Tolling Hormuz https://enotrans.org/wp-content/uploads/2026/03/Debra-Calhoun-lg-header.png
500
2096
Rebecca Higgins
https://enotrans.org/wp-content/uploads/2022/12/Eno-Logo-2.png
Rebecca Higgins2026-03-31 13:28:382026-03-31 15:20:23Making More Visible the Often-Invisible Inland Waterways
https://enotrans.org/wp-content/uploads/2026/03/Debra-Calhoun-lg-header.png
500
2096
Rebecca Higgins
https://enotrans.org/wp-content/uploads/2022/12/Eno-Logo-2.png
Rebecca Higgins2026-03-31 13:28:382026-03-31 15:20:23Making More Visible the Often-Invisible Inland Waterways https://enotrans.org/wp-content/uploads/2026/02/a-boat.jpg
1499
2000
Sohail Husain
https://enotrans.org/wp-content/uploads/2022/12/Eno-Logo-2.png
Sohail Husain2026-03-20 12:41:262026-03-20 12:41:26House Judiciary Committee Meets to Discuss Antitrust Exemption in Maritime Shipping
https://enotrans.org/wp-content/uploads/2026/02/a-boat.jpg
1499
2000
Sohail Husain
https://enotrans.org/wp-content/uploads/2022/12/Eno-Logo-2.png
Sohail Husain2026-03-20 12:41:262026-03-20 12:41:26House Judiciary Committee Meets to Discuss Antitrust Exemption in Maritime Shipping https://enotrans.org/wp-content/uploads/2026/03/Screenshot-2026-03-06-133311.png
595
709
Rebecca Higgins
https://enotrans.org/wp-content/uploads/2022/12/Eno-Logo-2.png
Rebecca Higgins2026-03-06 15:30:262026-03-06 15:30:26Tracking Transportation Impacts from Military Engagement in Iran
https://enotrans.org/wp-content/uploads/2026/02/Shipbuilding.jpg
1500
2000
kferrell
https://enotrans.org/wp-content/uploads/2022/12/Eno-Logo-2.png
kferrell2026-02-20 15:27:242026-02-20 15:27:24Trump Envisions “Maritime Golden Age” through Investments, Fees, and Deregulation
https://enotrans.org/wp-content/uploads/2026/03/Screenshot-2026-03-06-133311.png
595
709
Rebecca Higgins
https://enotrans.org/wp-content/uploads/2022/12/Eno-Logo-2.png
Rebecca Higgins2026-03-06 15:30:262026-03-06 15:30:26Tracking Transportation Impacts from Military Engagement in Iran
https://enotrans.org/wp-content/uploads/2026/02/Shipbuilding.jpg
1500
2000
kferrell
https://enotrans.org/wp-content/uploads/2022/12/Eno-Logo-2.png
kferrell2026-02-20 15:27:242026-02-20 15:27:24Trump Envisions “Maritime Golden Age” through Investments, Fees, and Deregulation https://enotrans.org/wp-content/uploads/2025/12/Coast-Guard.jpg
1414
2121
kferrell
https://enotrans.org/wp-content/uploads/2022/12/Eno-Logo-2.png
kferrell2025-12-19 14:59:172025-12-19 15:48:29The Coast Guard’s Ongoing Experience with New Technology
https://enotrans.org/wp-content/uploads/2025/12/Coast-Guard.jpg
1414
2121
kferrell
https://enotrans.org/wp-content/uploads/2022/12/Eno-Logo-2.png
kferrell2025-12-19 14:59:172025-12-19 15:48:29The Coast Guard’s Ongoing Experience with New Technology https://enotrans.org/wp-content/uploads/2025/10/maritime.jpg
1498
2000
kferrell
https://enotrans.org/wp-content/uploads/2022/12/Eno-Logo-2.png
kferrell2025-10-24 15:18:312025-10-24 16:18:01Senate Commerce Committee Holds Hearing on Maritime-Related nominations
https://enotrans.org/wp-content/uploads/2025/09/Maritime-Fuel-scaled.jpg
1440
2560
kferrell
https://enotrans.org/wp-content/uploads/2022/12/Eno-Logo-2.png
kferrell2025-09-12 16:10:312025-09-12 16:10:31Maritime Decarbonization – US Moves Pale Next to IMO’s
https://enotrans.org/wp-content/uploads/2025/10/maritime.jpg
1498
2000
kferrell
https://enotrans.org/wp-content/uploads/2022/12/Eno-Logo-2.png
kferrell2025-10-24 15:18:312025-10-24 16:18:01Senate Commerce Committee Holds Hearing on Maritime-Related nominations
https://enotrans.org/wp-content/uploads/2025/09/Maritime-Fuel-scaled.jpg
1440
2560
kferrell
https://enotrans.org/wp-content/uploads/2022/12/Eno-Logo-2.png
kferrell2025-09-12 16:10:312025-09-12 16:10:31Maritime Decarbonization – US Moves Pale Next to IMO’s https://enotrans.org/wp-content/uploads/2025/05/cargo-theft-scaled.jpg
1707
2560
kferrell
https://enotrans.org/wp-content/uploads/2022/12/Eno-Logo-2.png
kferrell2025-05-02 14:42:202025-05-02 16:00:17Roundtable: Combatting Cargo Theft: Stakeholder Perspectives
https://enotrans.org/wp-content/uploads/2025/05/cargo-theft-scaled.jpg
1707
2560
kferrell
https://enotrans.org/wp-content/uploads/2022/12/Eno-Logo-2.png
kferrell2025-05-02 14:42:202025-05-02 16:00:17Roundtable: Combatting Cargo Theft: Stakeholder Perspectives 
