GIS Application in Transportation Policy: Railroad Grade Crossing Safety
In the transportation world, agencies and policymakers are often asked to make difficult choices about where to invest limited resources, which projects to prioritize, or how to improve safety. Research plays an important role in this process. Aided by clear evidence and rigorous research, decision-makers are positioned to understand the scale of a problem, identify patterns, and create impactful policies to address transportation challenges. These challenges can be technical or financial, but they can also be spatial. Understanding where transportation problems occur helps practitioners understand why or how a problem occurs.
Geographic Information Science (GIS) connects where problems occur with the conditions that explain them: connecting the where to the how and why. While GIS is often associated with mapping, it more broadly helps researchers organize, analyze, and visualize data. This makes GIS an important tool for researchers and policymakers as they work to solve transportation problems that have a spatial element.
A GIS-based analysis is helpful for agencies to make more strategic choices. This piece acts as a case study of GIS application in transportation policy. The purpose of the study is to demonstrate to transportation policy audiences how GIS can assist transportation agencies in making stronger policy decisions by visualizing and analyzing data related to a specific problem.
The case study below uses railroad grade crossing safety in North Carolina as an example of GIS application. There are two key findings from the GIS analysis:
- Grade Crossing Incidents are clustered in certain census tracts of North Carolina.
- Grade Crossing infrastructure and train volumes are related to incident rates in North Carolina census tracts.
While these findings are useful for policymakers in North Carolina interested in improving grade crossing safety, the primary objective of this piece is to demonstrate how GIS analysis can be applied to a transportation policy problem, using railroad grade crossing safety as a case study example.
Grade Crossing Safety in North Carolina
Railroad grade crossings are locations where roads and rail lines intersect. This interaction between road and rail creates conflict points between trains, vehicles, and sometimes pedestrians. Addressing safety at these locations requires governments and transportation agencies to decide where to monitor conditions, improve designs, add or upgrade warning devices, eliminate crossings, and allocate limited funds. This piece applies a GIS-based approach to railroad grade crossing safety, specifically looking at grade crossing locations and incidents in North Carolina, from 2000 to 2025. It asks two questions: where do grade crossing incidents cluster and are there certain factors that are associated with grade crossing incidents?
For the first question, this analysis examines how incidents are spatially distributed across the state. Incidents are divided between total incidents and casualties, defined here as fatalities plus injuries. This distinction matters because total incidents can include minor crashes, while casualties point to more severe safety outcomes. If total incidents and casualties are clustered, the GIS tools will identify where total incidents and casualties are concentrated, known as hotspots. That information can help agencies match interventions to the problem: costly grade separations are set aside for casualty hotspots, while less expensive steps such as signal upgrades or signage improvements are reserved for areas with more minor incidents.
The second question looks at whether incidents are associated with crossing infrastructure and train volume, using a regression analysis. The regression does not prove that any one factor causes incidents but identifies relationships that can guide further research.
The research uses data from multiple federal and state sources. The Federal Railroad Administration (FRA) Highway-Rail Grade Crossing Incident database (Form 57) provides the incident data, and the FRA Crossing Inventory (Form 71) provides location data for crossings, train volumes per crossing, and the style of infrastructure for each crossing. Passive crossings have only stop signs, yield signs, crossbucks, or no infrastructure while active crossings have bells, lights, or grade crossing arms. The U.S. Census Bureau provides socio-economic data, and the North Carolina One Map source provides the rail line data for the state. Prior to any spatial analysis, data is organized and combined into one dataset that includes incident counts, crossing locations, train volumes, crossing infrastructure type and socio-economic indicators, all aggregated to the census tract level. This creates the main dataset for the hotspot and regression analyses. The regression also uses an incident rate variable, calculated as incidents per crossing.
Hotspot Analysis
The hotspot analysis begins with testing whether tract level incidents and total casualty counts are spatially clustered, which means whether there are areas in North Carolina where total incidents and casualty counts are concentrated. The GIS software runs a test and provides a score called a Global Moran’s I, which indicates whether similar values cluster near one another. A positive Moran’s I will indicate clustering of similar values in areas around the state and a negative Moran’s I will indicate a more dispersed pattern. The tests for total incidents and casualties yield positive results, meaning clustering of incidents and casualties occur in specific areas in North Carolina. The test for total incidents produces a low but significant value. However, the test for casualties produces a very low but significant value.
This finding matters because a non-spatial analysis would have missed this clustering pattern. A statewide count shows the scale of the problem, but it does not show whether high-incident tracts are near one another. The spatial test shows that some crossing safety concerns occur in certain areas, giving practitioners a clear starting point for reviewing grade crossing safety improvements.
Figure 1. Hotspots for Total Crossing Incidents in North Carolina
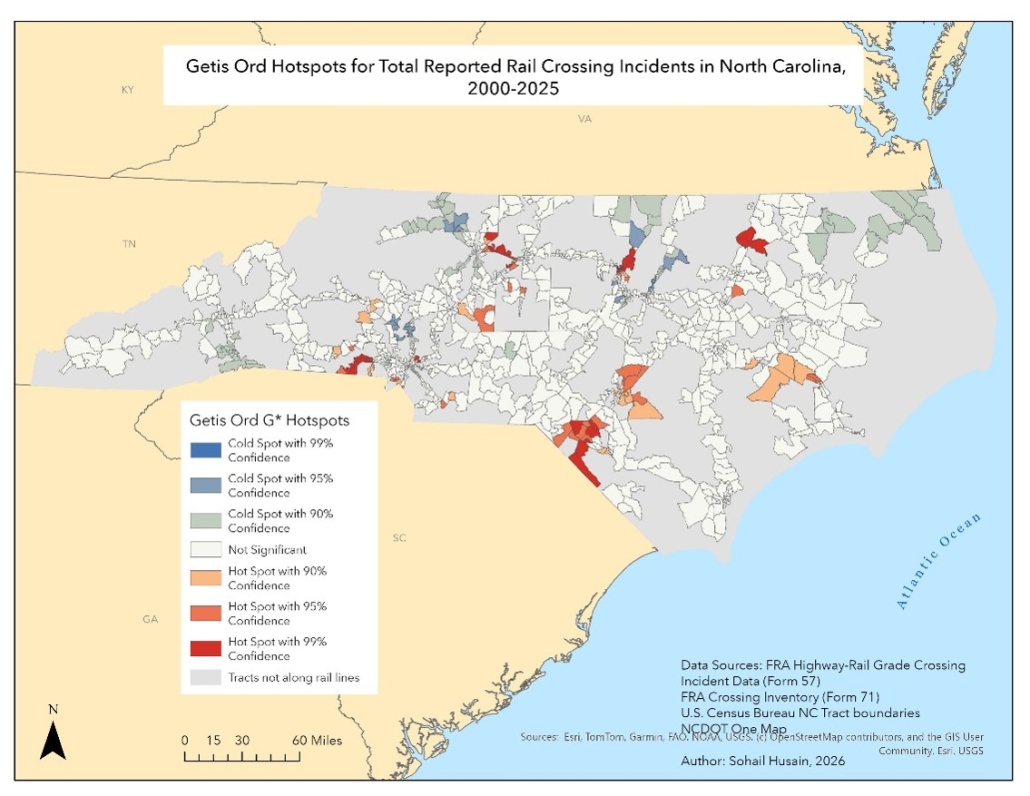
Figure 2. Hotspots for Crossing Casualties in North Carolina
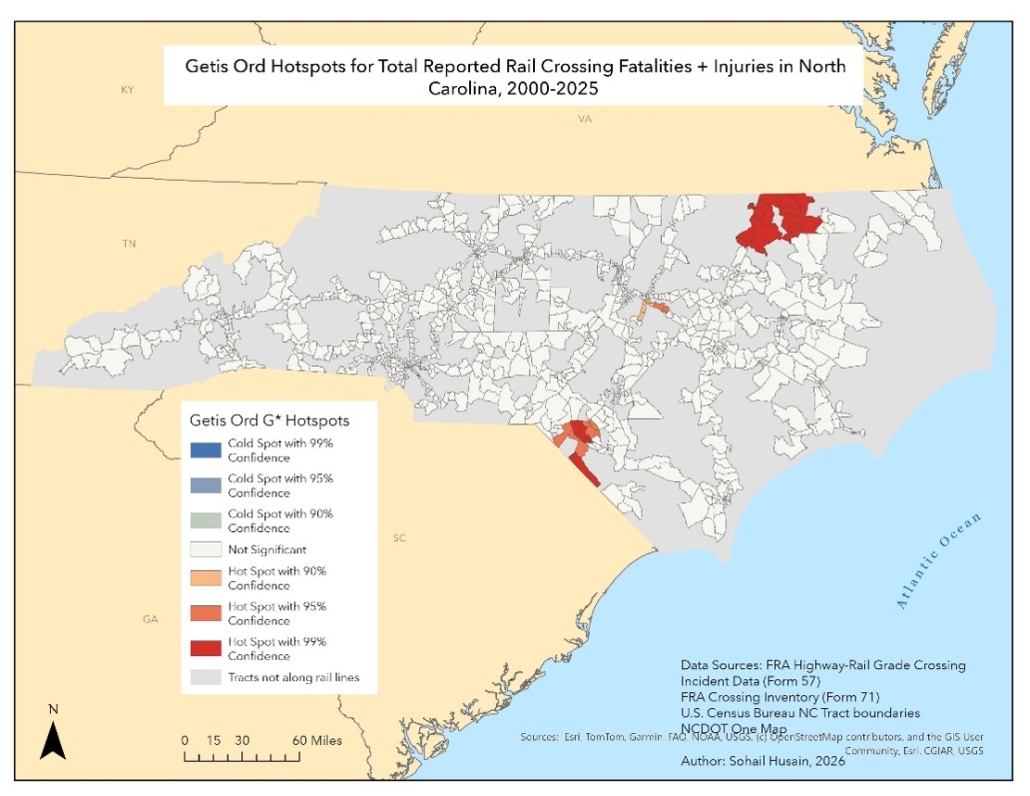
The GIS software visualizes where the clustering is happening through a Getis-Ord hotspot map (named after two famous geographers and statisticians), shown in Figure 1 and Figure 2 above. Hotspots for total incidents, shown in Figure 1, concentrate in census tracts in the Charlotte, Greensboro-High Point-Winston Salem (Piedmont Triad), and Raleigh-Durham-Chapel Hill (Triangle) metropolitan areas. There are also pockets of eastern NC with hotspots. This clustering makes sense. The major NC metros are high-traffic areas which increase the opportunities for incidents at crossings. The clustering is consistent with the fact that there are many freight and passenger trains running through the three main urban areas in the state. Hotspots for casualties are far fewer than hotspots for total incidents, as shown in Figure 2. Hotspots for casualties are in similar pockets of eastern NC visible in Figure 1. These eastern tracts are more rural, with less traffic, but have significant clustering of casualties. Separation of total incidents and casualties is important here. NCDOT can take this finding to prioritize major investments like grade crossing eliminations for the areas that have casualty hotspots, and reserve lower cost interventions for other areas.
A useful next step is to examine individual hotspot areas in more detail by overlaying the locations of active and passive crossings. This helps answer whether high-incident areas are dominated by passive crossings, active crossings, or a mix of both. This distinction has direct policy implications. If a hotspot contains many passive crossings, agencies must assess whether additional warning devices like bells or lights are warranted. If a hotspot contains mostly active crossings, other factors could be at play, like train frequency.
Figure 3. Crossing Locations Against Hotspots in Southwest NC
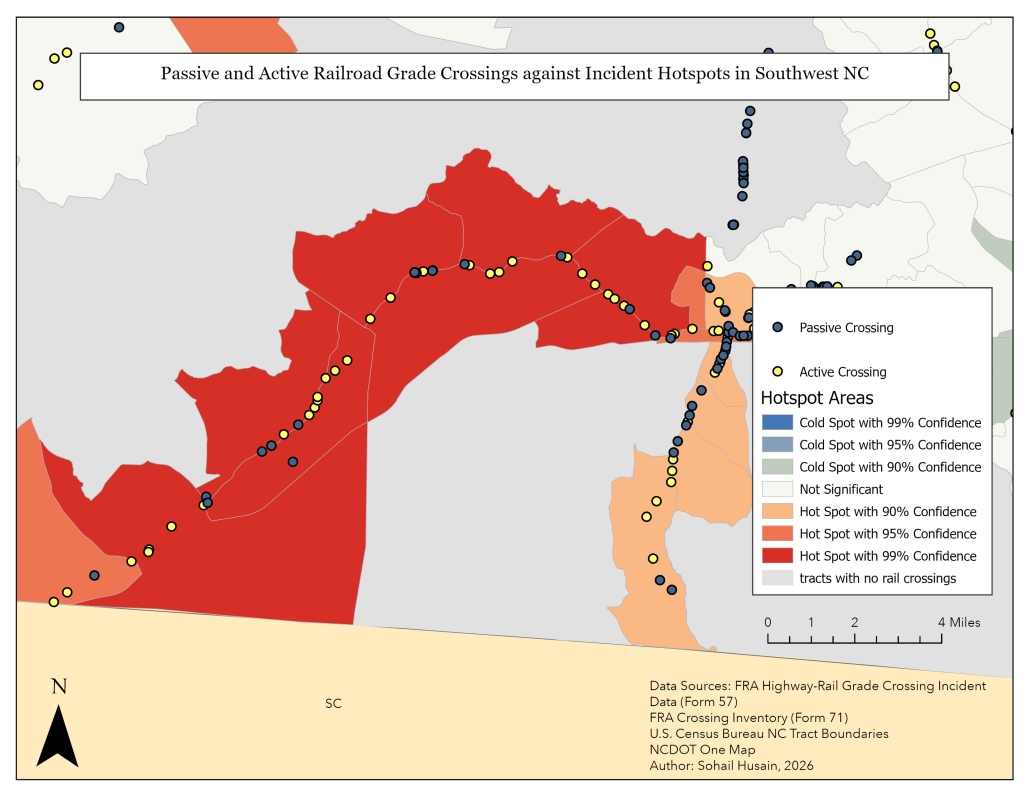
Figure 4. Crossing Locations Against Hotspots in the Raleigh metro area
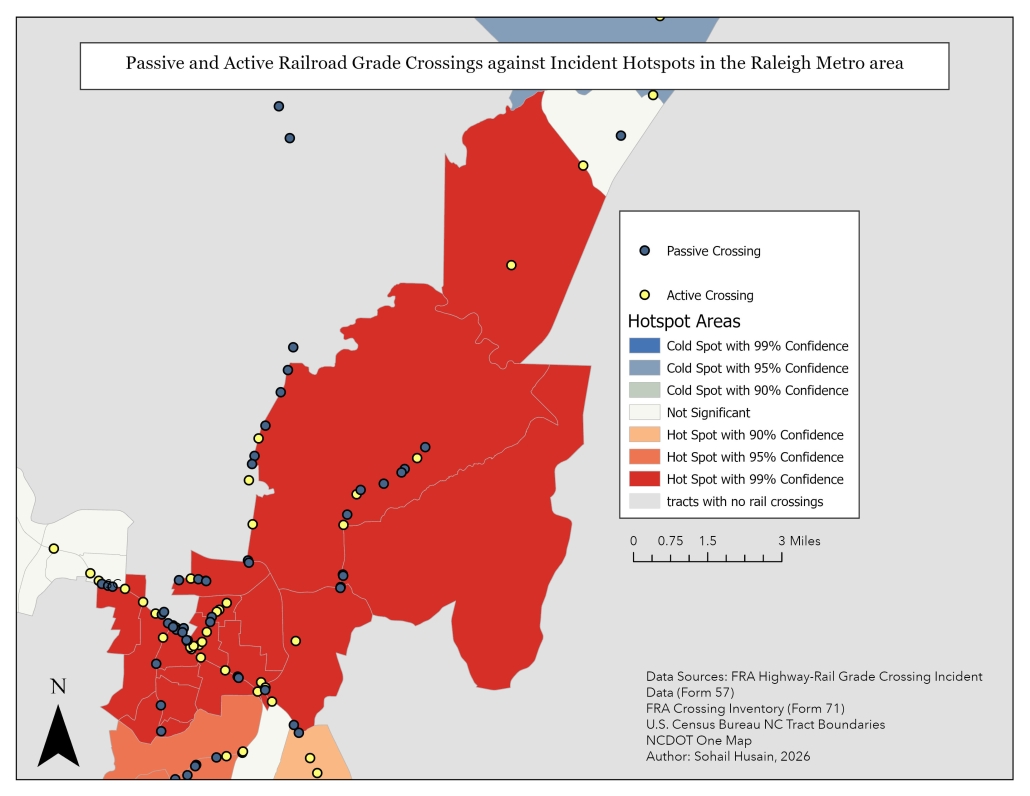
Total incident hotspot areas appear to have a mix of both active and passive crossings, shown in Figure 3 and 4. According to Figure 3, there are slightly more active crossings in the hotspot areas in Southwest NC, but neither map shows a dominant crossing type in either Southwest NC or in the Raleigh metro area. This suggests that infrastructure type alone does not explain why these areas appear as hotspots.
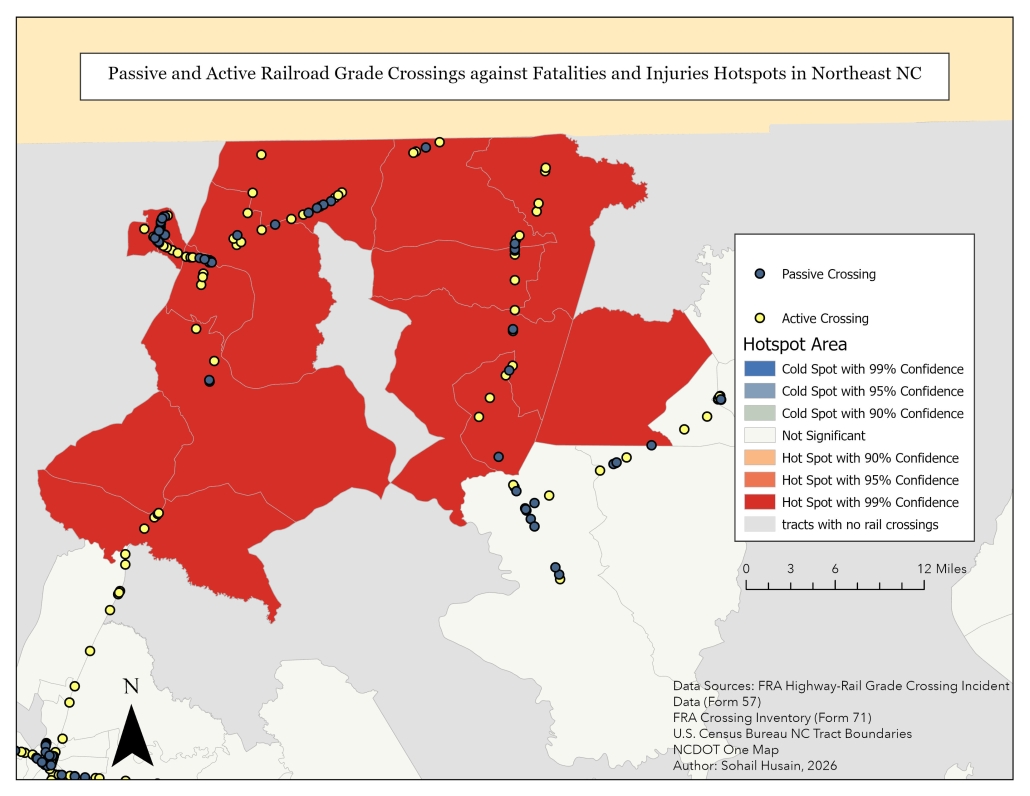
The same is true for casualty hotspots. Figure 5 shows crossing locations in Southeast NC and Figure 6 for Northeast NC, both areas with rural tracts. There is a mix of passive and active crossings, so it is not apparent from an initial visual inspection that active or passive crossings are related to hotspot areas. This finding leads to the second part of the analysis: testing the relationship between crossing infrastructure and incident rate.
Figure 5. Crossing Location Against Hotspot in Southeast NC
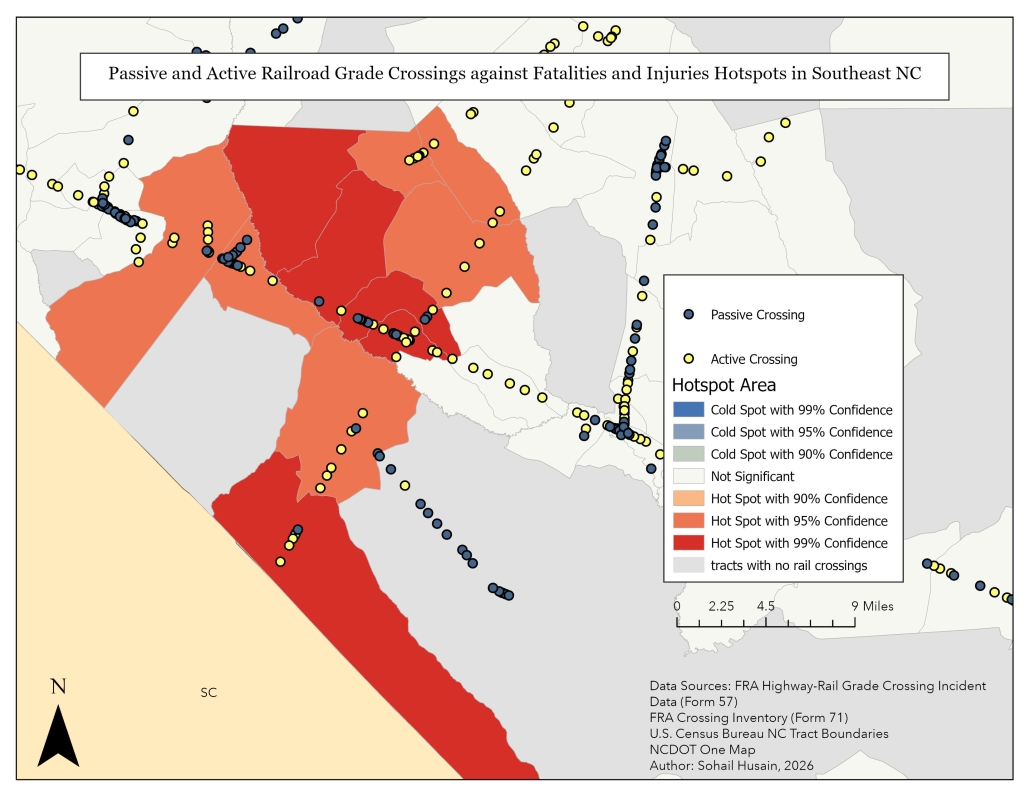
Figure 6. Crossing Locations Against Hotspot in Northeast NC
Regression Analysis
Regression analysis is a statistical method that tests whether an outcome variable (incident rate in this case) is associated with several independent variables. GIS software is able to conduct this analysis, making GIS tools valuable for analyzing data beyond the mapping component.
The main independent variables for this analysis are the share of crossings in each census tract with passive warning devices (stop signs, crossbucks) and the share with active warning devices. Other independent variables in the analysis include median household income, race, and education, which act as controls for the analysis. The results of the analysis are interpreted as associations rather than causal effects.
The initial regression results show that passive crossing infrastructure is associated with incident rate per crossing and the relationship is statistically significant. In other words, census tracts with a higher share of passive crossings tend to have lower incident rates. Because the result is statistically significant, it is unlikely that this relationship occurs by chance.
The active crossing variable shows the opposite pattern. It is positively associated with incident rates and is also statistically significant. This means that census tracts with a higher share of active crossings tend to have higher incident rates. At first, this result seems counterintuitive. Active crossings have more protective infrastructure such as crossing arms, lights, or bells while passive crossings have fewer protections. Based on infrastructure alone, we might expect passive crossings to have higher incident rates. However, another factor may help explain the result: total train traffic per crossing.
The second regression analysis adds total train traffic. The results show that the total train traffic variable is positively associated with incident rate and is statistically significant. This makes sense because more trains moving through the crossings create more opportunities for conflicts with vehicles or pedestrians. It is important to note that while the total train traffic variable is positively associated with incident rate, the relationship is not strong. What matters is there is an observed relationship suggesting that train traffic helps explain why some crossings have higher incident rates.
GIS Analysis Implications
Overall, the hotspot and regression analysis provide a useful way to examine grade crossing safety in North Carolina, but the results should be interpreted with several limitations in mind. First, hotspot results depend on the unit of analysis. Census tracts are useful for summarizing spatial patterns, but they can obscure crossing-specific conditions. Second, the relationship between crossing infrastructure and incident rate is not necessarily causal. Active warning devices are often installed at crossings that already have higher traffic volumes or safety concerns, so a positive relationship between active crossings and incident rate reflects a pre-existing risk rather than the effect of the infrastructure itself. Third, the analysis would improve with measures of roadway traffic or land-use.
Even with these limitations, the analysis shows how GIS supports transportation policy by applying data visualization and analysis to specific transportation problems. The value of GIS is showing where incidents occur and connecting safety outcomes like incident rate with the surrounding physical and social conditions. For grade crossings, this GIS analysis positions policymakers to look beyond general state-wide incident totals and identify specific areas where incidents are concentrated and prioritize safety funds to the casualty hotspots. The GIS-based approach also raises questions for further study, including whether passive crossings near high-traffic roads need additional warning devices, or whether incident rates change after infrastructure upgrades.
More broadly, the GIS-based approach demonstrates how spatial analysis makes transportation policy more targeted and evidence-based. Transportation decisions involve competing needs and limited resources. Spatial analysis helps decision-makers move from general goals, such as improving rail crossing safety, to specific interventions in specific places. In that sense, GIS serves an important intersection between data analysis and policy action.
