Has New York’s Congestion Pricing Reduced Congestion?
A primary goal of New York’s congestion pricing program is to discourage some drivers from entering Manhattan at or below 60 Street, during the times of day when streets are most congested. Based on that measure and many others (including transit ridership, bus speeds, trip reliability, and traffic accidents) – the program has been a resounding success.
About 1.5 million people work in the 8 square mile tolling zone. This central business district is not only the largest one in the U.S., but it contains more office space than the next five business districts combined. Since January 5, vehicles crossing into the zone have been charged $9.00 (between 5 AM and 9 PM on weekdays, and between 9 AM and 9 PM on weekends).
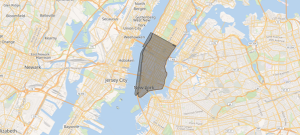
Map of Manhattan’s congestion pricing zone (New Jersey is to the left; Queens and Brooklyn are to the right.)
New York University’s C2SMARTER transportation research center held a panel on April 17 to discuss congestion pricing. The center is developing new technologies to help reduce congestion, and it has created an interactive data dashboard which integrates several data sources to track the impacts of congestion pricing on the region’s transportation system.
Roadway Density and Speed
Taking data from approximately 400 public traffic cameras located within and around the congestion pricing zone, the center’s researchers are using advanced computer vision techniques to estimate multimodal traffic use and density. (Density refers to the average number of road users visible in individual camera snapshots collected every 30 minutes, indicating how crowded a road segment appears at a given time.)
A comparison between weekdays in 2025 and 2024, to date, shows the average density of passenger vehicles decreased by 5.4 percent. At the same time, the density of pedestrians increased by 4.1 percent and bicycles increased by 10.3 percent. The increase in the number of bicycles surprised the researchers, since early 2025 was colder with more snow than the same period in 2024.
The dashboard shows changes street by street. For example, traffic speeds on Eighth Avenue, north of Times Square, increased from 7.6 miles to 15.5 miles per hour, while speeds decreased from 3.9 to 1.7 miles per hour on 42 Street near Grand Central Terminal.
Number of Vehicles and Transit Ridership
Remarkably, traffic volumes are down despite the fact that more workers are going back to their offices. The Partnership for New York City, a business advocacy group which represents many of the city’s largest employers, surveyed employers in March and found that Manhattan office workers are at their offices at a rate that is 76 percent of pre-pandemic levels compared to 72 percent in 2024.
According to congestion pricing advocates, approximately 80,000 fewer vehicles are entering the zone on a typical day, a reduction of about 12 percent. Within the zone, travel times have decreased for drivers between 10 percent to 30 percent on all crossings.
The Port Authority, which operates bridges and tunnels between New York and New Jersey, is also showing changes in traffic volumes. The Holland Tunnel has 5 percent fewer vehicles and the Lincoln Tunnel has 8.2 percent less. However, the George Washington Bridge, which is located north of the congestion pricing zone, now has 1.3 percent more vehicles.
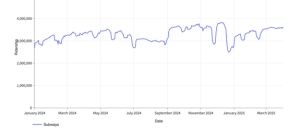
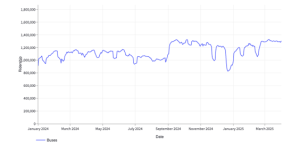
The Metropolitan Transportation Authority (MTA) estimates that in March the number of vehicles entering the central business district was 13 percent less than it would have been without the toll, based on historical averages. The agency is delighted that transit use is increasing. As shown below, the MTA’s dashboard reveals a modest increase in subway and bus ridership, year over year.
Panelists
C2SMARTER’s panel, which consisted of three congestion pricing advocates, all praised the program’s benefits and lamented US DOT’s threats that are jeopardizing its future. (See April 21 letter from DOT Secretary Sean Duffy to New York Governor Kathy Hochul, warning that US DOT will begin withholding federal highway funds and projects approvals, unless New York terminates the program.)
Charles Komanoff (former head of Transportation Alternatives), Rachel Weinberger (from the Regional Plan Association), and Brian Fritsch (from the Permanent Citizens Advisory Committee) all pointed to the benefits seen by drivers, transit riders, and pedestrians.
Weinberger said, “Early results are exactly consistent with what the congestion pricing models predicted.” Both Weinberger and Komanoff would like New York’s governor to increase the toll, so that drivers are charged for more of the “external costs” associated with driving. Each additional driver, they explained, adds to the region’s traffic delays, fuel consumption, accidents, air pollution, and greenhouse gas emissions.
Weinberger referred to the poster, below, showing how cars lead to an inefficient use of urban space.
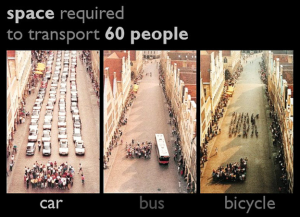
Source: Press Office, City of Munster, Germany.
The panelists noted how the details of New York’s congestion pricing program was a political compromise that occurred after decades of debate and the perseverance of hundreds of relentless advocates. Fritsch said the program’s naysayers have been proven wrong. There “hasn’t been chaos and mayhem outside of the zone” and it is not hurting businesses.
Broadway and Bike Sharing
In fact, the Broadway League reports that gross revenues at New York’s Broadway theaters, as shown below, are substantially higher than a year earlier. Note that theater sales are impacted by many other factors besides congestion pricing such as tourist levels, price changes, and who is starring in a Broadway show. (Heads up to Eno’s theater fans: Tony Awards nominations for 2025 will be announced on May 1st)
| Week Ending | 2024 Revenue | 2025 Revenue |
| April 13 | $35.6 | $44.2 |
| April 6 | $39.4 | $42.4 |
| March 30 | $37.1 | $43.8 |
| March 23 | $28.5 | $41.2 |
| March 16 | $28.1 | $37.5 |
Another indicator of congestion pricing’s impacts is seen in the number of people using Citibike, New York City’s ridesharing program. The number of rides in the first quarter is nearly 11.8 percent higher than the previous year.
| Citibike Rides Per Day | 2024 | 2025 |
| January | 60,703 | 68,391 |
| February | 72,966 | 72,371 |
| March | 85,690 | 104,557 |
Safety
Finally, the most important charts. Fewer people were injured or killed in motor vehicle collisions in Manhattan in February and March 2025 compared to a year earlier, according to the New York Police Department. Since 2024 was a leap year and February had 29 days, the number of collisions is also shown for the average day.
| Number of Motor Vehicle Collisions | February 2024 | February 2025 |
| 1,075 (average of 37 per day) | 935 (average of 33 per day) |
| Persons injured or killed | Injured | Killed | Injured | Killed |
| Motorists | 191 | 0 | 135 | 0 |
| Passengers | 101 | 0 | 95 | 1 |
| Cyclists | 105 | 0 | 69 | 0 |
| Pedestrians | 126 | 2 | 128 | 3 |
| Number of motor vehicle collisions | March 2024 | March 2025 |
| 1,225 | 1,154 |
| Persons injured or killed | Injured | Killed | Injured | Killed |
| Motorists | 195 | 2 | 195 | 0 |
| Passengers | 155 | 0 | 109 | 0 |
| Cyclists | 100 | 1 | 108 | 0 |
| Pedestrians | 127 | 2 | 125 | 0 |
For more information about congestion pricing, see the following:
Timeframe for Court Showdown on NYC Congestion Pricing Becomes Clear. April 2025
Congestion Pricing in New York: Beware the Even Years. June 2024.
How Would Killing NYC Congestion Pricing Affect Transit Funding? June 2024
New York MTA Outlines $16.5B in Capital Funding Cuts Due to Delay of Congestion Pricing June 2024
Eno’s Congestion Pricing report May 2020.

