Grant Processing Slowdown Will Mean Larger August Redistribution
This year’s delays in obligating competitive highway and bridge grants will reverse progress made by Congress last year on reducing the size of the annual “August redistribution” of highway money and will see extra billions of highway formula money delayed until the last month of fiscal 2026.
This was revealed in the October 16 release of the year-long highway program funding obligation limitation notice (N4520.292) by the Federal Highway Administration. The notice revealed that the amount of unobligated “carryover” contract authority held by FHWA at the end of fiscal year 2025 had swelled to $7.82 billion. (The notice doesn’t actually give the number, but you can reverse-engineer it from the amount of new contract authority created by the IIJA (a known quantity) and the fact that the allocated carryover was 12.6 percent of that amount, a percentage that was mentioned in the notice.)
The $7.82 billion represents unobligated amounts given in prior years for competitive INFRA, PROTECT, and bridge grants, as well as unobligated federal lands highway and FHWA research programs from prior years. Because that money wasn’t obligated, new obligation limitation has to be reserved for it. In effect, almost all of the new spending authority given to FHWA for fiscal year 2026 has to be shrunk by 12.6 percent in order to fit this large carryover. For example, the $900 million in new INFRA grant contract authority for FY 2026 will be reduced to $786.6 million, and the
Going back to the dawn of the obligation limitation process in the mid-1970s, there has always been some kind of shrinkage for allocated carryover, but it was small. As recently as 2012, it was only about four percent. But the growth in competitive grants has caused the shrinkage to balloon of late.

The reductions in new non-formula funding because of carryover are permanent. The reduction in formula funding is only temporary, because every August, those allocated programs shut down and any unused obligation limitation associated with them gets given back to states at the end of August for a use-it-or-lose-it contract signing spree until the end of the fiscal year.
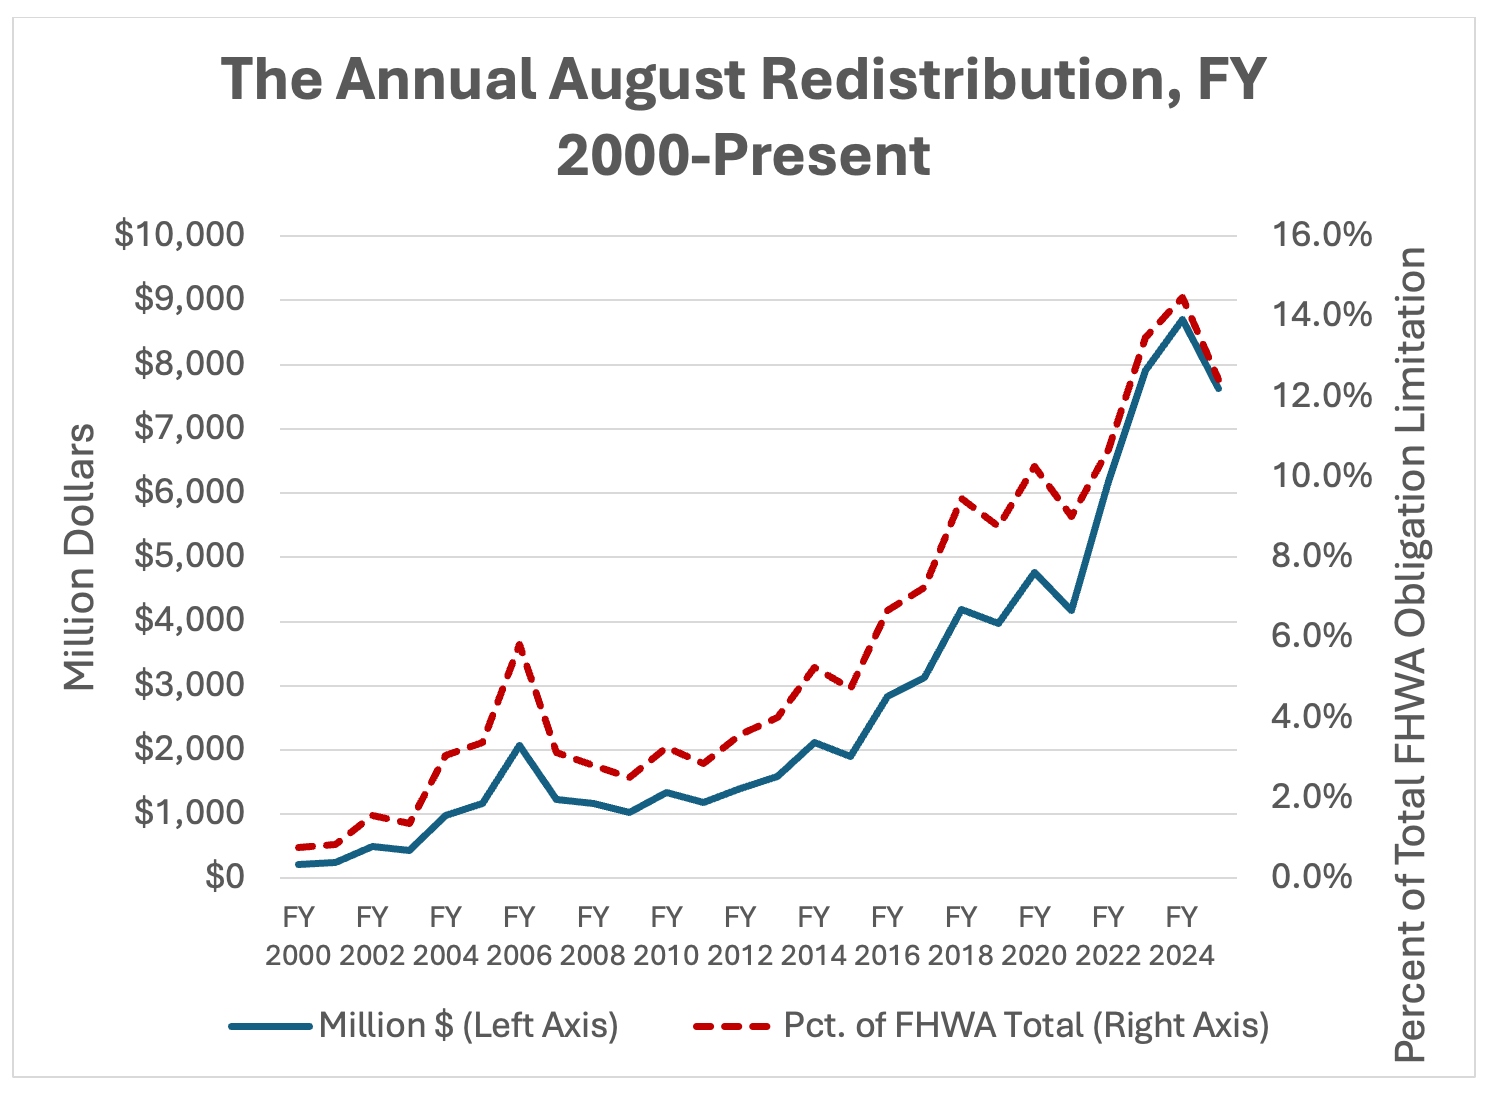
The growth in slow-signing allocated programs had pushed the size of the August redistribution up to nearly 14 percent of the total FHWA contract authority budget by 2024, which is terrible from a financial planning perspective. Having 14 percent of the budget spent solely on who can spend the money within 30 days, as opposed to who can spend the money wisely or well, is not exactly a “best practice.”
Congress tried to shrink the August Redistribution for 2025, by including language in the water resources bill that transferred $1.8 billion in unobligated TIFIA credit assistance balances to state highway formula funding, thus shrinking carryover by that amount. (The Appropriations Committees also stole $400 million in TIFIA money to transfer to a competitive bridge program, but we don’t have evidence yet of that spending any faster.)
As a result, the size of the August redistribution shrunk noticeably in August 2025.
But the TIFIA well has run dry. The WRDA bill also provided that at the end of FY 2025, 75 percent of any new TIFIA funding that was still unobligated would also be transferred out. FHWA notified the public on August 4 that “As of April 1, 2025, the FY 2025 TIFIA Program contract authority estimated to remain unobligated at the end of FY 2025 is zero. As such, no FY 2025 TIFIA Program funds will be redistributed to the States…”
And the slowdown in grant obligation caused by the Trump Administration’s comprehensive grant review has reversed all of the progress made by Congress last year. The allocated carryover at the start of fiscal 2024 was $7.85 billion. This actually shrank by the time of the FY 2025 ob limit calculation, to $7.31 billion, and the August redistribution shrank accordingly. But now, we are back up to $7.82 billion in carryover, meaning that the August redistribution will probably increase back to where it was.
This means that the August 2026 redistribution will probably be back north of $8 billion, and FHWA will have to work hand-in-glove with states again to make sure that they are able to spend all of the money. (Two years ago there was a frightening instance of the AR being so large that FHWA had to go back to states three times begging them to ask for more money so they were not put in the embarrassing spot of turning money away, unspent, and letting it lapse on September 30.)
| Total Obligation Limitation | Initial Allocated Reserve | Redistributed to States in August | IAR as % of Total | AugR as % of Total | |
| FY 2000 | $27,701,350,000 | $2,653,716,239 | $216,135,899 | 9.6% | 0.8% |
| FY 2001 | $29,661,806,000 | $2,617,040,418 | $254,605,641 | 8.8% | 0.9% |
| FY 2002 | $31,799,104,000 | $2,445,244,354 | $495,383,586 | 7.7% | 1.6% |
| FY 2003 | $31,593,000,000 | $3,215,368,543 | $432,391,111 | 10.2% | 1.4% |
| FY 2004 | $31,890,519,230 | $3,355,378,838 | $973,838,857 | 10.5% | 3.1% |
| FY 2005 | $34,419,420,000 | $3,832,412,032 | $1,167,701,604 | 11.1% | 3.4% |
| FY 2006 | $35,672,020,464 | $5,303,970,981 | $2,076,788,143 | 14.9% | 5.8% |
| FY 2007 | $39,086,465,000 | $3,932,076,883 | $1,223,675,007 | 10.1% | 3.1% |
| FY 2008 | $41,216,051,000 | $4,220,845,303 | $1,160,367,604 | 10.2% | 2.8% |
| FY 2009 | $40,700,000,000 | $3,712,993,860 | $1,028,541,567 | 9.1% | 2.5% |
| FY 2010 | $41,107,000,000 | $4,119,915,573 | $1,336,569,692 | 10.0% | 3.3% |
| FY 2011 | $41,107,000,000 | $4,396,226,930 | $1,182,665,012 | 10.7% | 2.9% |
| FY 2012 | $39,143,583,000 | $4,141,848,975 | $1,400,464,387 | 10.6% | 3.6% |
| FY 2013 | $39,699,000,000 | $4,367,010,516 | $1,595,648,530 | 11.0% | 4.0% |
| FY 2014 | $40,256,000,000 | $4,995,844,093 | $2,117,694,862 | 12.4% | 5.3% |
| FY 2015 | $40,256,000,000 | $5,220,715,435 | $1,906,572,178 | 13.0% | 4.7% |
| FY 2016 | $42,361,000,000 | $5,250,644,793 | $2,832,803,208 | 12.4% | 6.7% |
| FY 2017 | $43,266,100,000 | $6,204,969,464 | $3,137,048,104 | 14.3% | 7.3% |
| FY 2018 | $44,234,212,000 | $6,805,433,470 | $4,183,936,196 | 15.4% | 9.5% |
| FY 2019 | $45,268,596,000 | $7,669,024,204 | $3,972,743,240 | 16.9% | 8.8% |
| FY 2020 | $46,365,092,000 | $7,618,346,821 | $4,762,052,903 | 16.4% | 10.3% |
| FY 2021 | $46,365,092,000 | $8,316,023,530 | $4,178,016,327 | 17.9% | 9.0% |
| FY 2022 | $57,743,430,000 | $10,083,718,032 | $6,176,517,471 | 17.5% | 10.7% |
| FY 2023 | $58,764,511,000 | $12,247,586,594 | $7,915,027,701 | 20.8% | 13.5% |
| FY 2024 | $60,095,782,888 | $13,190,085,292 | $8,697,560,906 | 21.9% | 14.5% |
| FY 2025 | $61,314,170,545 | $12,831,347,162 | $7,624,372,190 | 20.9% | 12.4% |
| FY 2026 | $62,657,105,821 | $13,512,947,709 | ????? | 21.6% | ????? |
