Comparing the Costs of Transit Projects: New Report and Interactive Graphs
Eno’s project delivery resources hub has a wealth of information to help transportation agencies and policy makers improve the planning, design, and construction of projects.
This hub now has two new resources. First, a new Eno report on the Federal Transit Administration’s (FTA’s) Capital Cost Database accompanied by interactive graphs. Second, an update to Eno’s own Transit Construction Cost Database and a new set of interactive graphs.
FTA’s Capital Cost Database (report and graphs)
Eno’s new report assesses the FTA’s capital cost database and provides recommendations for improving its usefulness. The FTA’s database contains cost components of federally funded transit projects over the last 40 years.
Eno worked with NYU’s Marron Institute to analyze the database’s 65 bus rapid transit, commuter rail, light rail, heavy rail and trolley projects. The report, funded by the FTA, highlights the database’s usefulness, potential, and limitations. It also includes a set of interactive graphs that summarize information in the database.
Although the database does not have the level of information that would be required to prepare detailed cost estimates, it can be a valuable tool for preparing ballpark estimates for conceptual projects. While the database is perhaps most useful during the project development phase, some grantees have used it during construction to compare their projects against the entire database or a subset.
Eric Goldwyn, NYU Marron Institute’s program director, said, “”We spend billions of public dollars on these projects. There should be good, unambiguous accounting so that we can compare and learn from past projects. The FTA Capital Cost Database is an attempt at this. It isn’t perfect, but it is a tool that can help project sponsors baseline projects and understand which components drive costs.”
FTA first published the database in 2010, and is now in its fourth iteration. It uses the following eight standard cost categories: (1) guideway & track elements, (2) stations, stops, terminals, intermodal, (3) support facilities: yards, shops, administrative buildings, (4) sitework and special conditions, (5) systems, (6) right of way, land, existing improvements, (7) vehicles, and (8) professional services. Each of these categories is also broken down in subcategories.
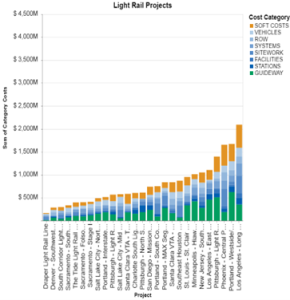
As part of the report, the research team prepared a set of graphs to compare projects. For example, Graph #1 below compares the cost of 27 light rail projects and Graph #2 compares the costs of 15 heavy rail projects. Both graphs separate costs by the eight categories and are shown in inflation-adjusted dollars. An additional set of interactive graphs are available at https://projectdelivery.enotrans.org/fta-capital-costs-database/.
Graph #1: Light Rail Project Costs
Graph #2: Heavy Rail Project Costs

The following graph shows how rail and bus rapid transit projects that include tunnels are significantly more expensive than at-grade transit projects. The x-axis shows the percentage of the line that is built in a tunnel. The y-axis shows the cost per mile.

Despite containing valuable data on projects spanning more than four decades, the database is not widely used. Working with the FTA, the research team prepared a set of recommendations to make the database more useful to transportation agencies and their stakeholders. Most importantly, FTA’s grantees need to make greater efforts to improve their cost reporting for both accuracy and completeness. Since grantees use different cost categories than the FTA, the process of converting data from one format to another can compromise data integrity, resulting in potential errors and inconsistencies.
Another recommendation is to make the data more consistent across projects. Agencies define costs differently which makes it difficult to compare projects. In interviews with cost estimators and agency staff, the research team repeatedly heard that the FTA’s Standard Cost Categories were useful, but not how most agencies do their internal accounting. One cost estimator explained that determining where costs go is sometimes “more of an art than a science.”
When the project team examined the Maintenance of Traffic subcategory, only three projects were found to have recorded any costs. Based on the team’s interviews with transit agencies, the maintenance of traffic is critical to agency projects; thus, it seems likely that these costs were folded into other categories.
The FTA should also consider how it could update the database more frequently. For example, information about the first phase of the Second Avenue Subway which opened on January 1, 2017 has not yet been added to the database because all of its costs have not been finalized.
Another recommendation relates to incorporating additional data. If the database could incorporate information that the FTA already collects, users could better understand some of the important factors that differentiate projects. For example, if ridership estimates were incorporated into the database (or hyperlinks provided to such information), users would be able to better understand why transit stations cost significantly more in one city than another.
Eno’s Transit Construction Cost Database (update and graphs)
Eno has updated its own construction cost database which contains information about nearly 300 large transit projects around the world. This database includes data on grade alignment, construction timelines, stations, and construction costs (adjusted for inflation). A wide variety of projects are included, such as a tram extension in Berlin, light rail line in Sydney, heavy rail line in Mexico City, and a subway line in New York.
Eno’s On the Right Track: Rail Transit Project Delivery Around the World report used this database to reveal that urban rail transit projects in the United States suffer from disproportionately high costs and long timelines compared to international peers. The US pays more than a 50 percent premium to build at-grade and tunneled rail projects despite its projects being relatively simpler in terms of engineering aspects.
Working with researchers at Carnegie Mellon University, Eno is now releasing a visual representation of Eno’s global database. A set of interactive graphs, titled “Transit Constructions Costs Data Explorer,” provide an easy way to compare a wide range of information. Moving the cursor along these graphs reveals relevant information about individual projects.
This explorer includes three key interactive graphs.
Average cost and time to construct by country: Comparison of costs by project type and mode.
State level costs and breakdowns: Comparison of the average cost of development by state and by four cost categories (construction, professional services, right-of-way and land acquisition, and other costs.)
Percent tunneled by U.S. state and project: Comparison of projects by the percent that each one is tunneled.

