Bus Network Redesigns in the Modern Age: How U.S. Transit Agencies Adapt to Evolving Travel
If you live in a major U.S. city, your local transit agency may have big changes in store. Perhaps you’ve chatted with an agency representative at a subway station, completed an online questionnaire about your rider experience, or seen notices at your bus stop highlighting upcoming route changes. All these signs indicate that your local bus service provider is examining its existing service in preparation for major updates. Transit agencies across the U.S. are restructuring their bus networks to better meet the needs of users. During these so-called bus network redesigns, transit agencies systematically assess both their existing service and transit users’ travel patterns to identify how agency resources can be used to better meet travel demand. Network redesigns might include:
- changes to route timetables and bus arrival frequencies,
- the consolidation of existing bus stops or the placement of new stops,
- modifications to routes, including their distances, termini, or paths taken,
- or the combination, elimination, or addition of entirely new routes.
Though transit agencies often amend individual routes to better support the full network, redesigns are more comprehensive, holistic endeavors. They consider bus service in the agency’s service region in its totality, with large-scale, systemic service changes on the table. Redesigns are complex and costly initiatives for multiple reasons. They require patience and time, typically requiring at least three years from announcement to implementation. They demand collaboration and dialogue among transit riders, bus operators, advocacy groups, agency staff, consultants, agency leadership, and many more stakeholders. They necessitate compromise, with new routing plans inevitably serving some neighborhoods and destinations better than others.
The goal of this article is to highlight the efforts of agencies making bold strides to transform their bus service for the people who rely on it. Network redesigns are complex; every locality approaches them differently. However, I try to find commonalities among their efforts – their impetuses, their methodologies, and their results. When salient, I also identify areas for improvement – changes that agencies could make to their redesign processes to ensure transparency, trust, and collaboration with residents. I culminate the study by diving deeper into the redesign New York’s Metropolitan Transportation Authority (MTA) plans to implement in Queens this summer. I hope this brief exploration of bus network redesigns across the country inspires you to engage with your own transit agency and their efforts to improve mobility, equity, and safety for people like you.
No Time Like the Present
The current moment offers a unique opportunity for cities to review their bus service. In many regions, network redesigns are overdue. Given that redesign efforts are time and labor intensive, many U.S. agencies have not comprehensively reevaluated their networks in decades. For example, the Massachusetts Bay Transportation Authority’s (MBTA’s) bus network in Boston bears strong resemblance to the city’s streetcar network from the early 20th century. During the 1950s and 60s, the Authority replaced its streetcars with buses, but largely maintained original routes. Since the mid-twentieth century, Boston’s settlement pattern has shifted. Residents are building up new neighborhoods and employment hubs further from downtown, the city’s historical center of commerce and industry. Its existing bus network, however, still prioritizes high speed service to its city center. Residents traveling to and from other neighborhoods are served less quickly and conveniently. Boston’s changing urban landscape reflects transformations across many U.S. cities. During the last 20 years, cities’ urban footprints have increased as residents and businesses look to suburbs for more space and cheaper rent. Subsequently, bus networks tuned to decades-old land use and travel patterns may no longer be efficient.

Figure 1. Tremont Street trolley in Boston circa 1930s. Trolley line is now MBTA bus route 43. Credit: City of Boston Archives. Creative Commons Attribution-Share Alike 2.0 Generic license.
Changes in travel proved gradual until 2020. The COVID-19 pandemic forced many to rethink their daily routines. One-fifth of U.S. employees now work fully remotely. In 2023 70 percent of job seekers expressed desire for new positions with flexible working arrangements. Fewer commutes have left peak-hour buses serving downtown cores sometimes underutilized. For example bus routes on San Francisco Municipal Railway (Muni) have experienced uneven post-pandemic recovery. Though the agency’s suburban ridership has largely rebounded, stops closer to the city’s Financial District are still less frequented. The Southeastern Pennsylvania Transportation Authority (SEPTA), which serves the Delaware Valley, announced its redesign effort in Winter 2021. Like many redesigns announced that year, they explicitly cite pandemic-induced travel patterns as a crucial opportunity to revise their routes.
Unfortunately, network redesigns are sometimes financial imperatives. Of the nation’s largest transit agencies, 71 percent report facing an impending fiscal cliff, exacerbated by pandemic-fueled changes in commuting, the expiration of COVID-19 relief funds, and the rising costs of labor and fleet maintenance. Investing in transit service can help providers avoid a transit “death spiral” whereby ridership declines mean reduced agency funding, which requires service reductions that further drive down ridership. Investing in effective, convenient bus service can break this cycle.
Finally, multiple agencies are amending their bus networks to better integrate with their city’s other transit offerings. King County Metro, which serves the Seattle area, has embarked upon two network redesigns, each tasked with connecting bus service with the region’s expanding Sound Transit light rail network. The redesign is a collaborative effort across multiple agencies, including King County Metro, Sound Transit, Community Transit serving Snohomish County, and the Seattle Department of Transportation. Metro’s redesigns remind us that mobility service in a region should be evaluated in its entirety: some users ride the bus to their destination. Others use it as a first or last-mile connection to subway or light rail lines.
While full redesigns can greatly improve a region’s mobility, they are not one-size-fits-all antidotes for struggling transit providers. Being resource intensive, disruptive to travel, and requiring buy-in from constituents and elected officials, incremental route changes may be more suitable interventions for some agencies.
Redesigns Sweep the Nation
Over the last 10 years, 17 of the nation’s 20 largest transit agencies have undertaken network redesign projects. Some agencies have even announced multiple redesigns efforts. New York City’s MTA has three network reforms in the works, each following a unique timeline. Table 1 lists these 17 redesign efforts by their approximate start date. Based on my definition of a bus network redesign, I exclude several initiatives from this list, including the MTA’s redesign in Staten Island because it considered only express bus service. Most agencies included here launched their redesign initiatives after COVID-19 pandemic travel restrictions began to lift. Several agencies, like Miami-Dade Transit, began their redesigns pre-COVID but elected to postpone planning efforts until in-person community outreach could resume. Though the pandemic briefly halted redesign work nationwide, the redesign movement is still strong.
Table 1. Bus network redesign initiatives among the 20 U.S. transit agencies with highest 2023 ridership by approximate planning start date. These dates were collected via a search of publicly available transit agency documents.
*Burlington, Camden, and Gloucester County region.
| Transit Agency | Redesign Initiative Name | Approx. Planning Start Date |
| METRO (Houston, TX) | System Reimagining | Winter 2013 |
| MTA Maryland (Baltimore, MD) | BaltimoreLink | Fall 2015 |
| MTS (San Diego, CA) | Transit Optimization Plan | Fall 2016 |
| LA Metro (Los Angeles, CA) | NextGen Bus Plan | Winter 2018 |
| MTA (New York, NY) | Bronx Local Bus Network Redesign | Summer 2018 |
| MBTA (Boston, MA) | Bus Network Redesign | Summer 2018 |
| MTA (New York, NY) | Queens Bus Network Redesign | Spring 2019 |
| Miami-Dade Transit (Miami, FL) | Better Bus Network | Summer 2019 |
| Denver RTD (Denver, CO) | Reimagine RTD | Summer 2019 |
| MTA (New York, NY) | Brooklyn Bus Network Redesign | Fall 2019 |
| NJ Transit (NJ) | NewBus Newark | Fall 2020 |
| SEPTA (Philadelphia, PA) | SEPTA Forward: Bus Revolution | Winter 2021 |
| TriMet (Portland, OR) | Forward Together | Winter 2021 |
| King County Metro (Seattle, WA) | East Link Connections | Spring 2021 |
| OCTA (Orange County, CA) | Making Better Connections | Summer 2021 |
| NJ Transit (NJ) | NewBus BCG* | Fall 2021 |
| MARTA (Atlanta, GA) | NextGen Bus | Fall 2021 |
| King County Metro (Seattle, WA) | Lynnwood Link Connections | Winter 2022 |
| WMATA (Washington, DC) | Better Bus Network Redesign | Fall 2022 |
| CTA (Chicago, IL) | Bus Vision Project | Winter 2023 |
| AC Transit (San Francisco Bay Area, CA) | Realign | Spring 2023 |
| PRT (Pittsburgh, PA) | Bus Line Redesign | Fall 2023 |
| NJ Transit (NJ) | NewBus Hudson | Fall 2024 |
Houston’s METRO is the Star Example
The Metropolitan Transit Authority of Harris County (METRO) completed a network redesign in the Houston, TX area in August 2015. Houston’s efforts ushered in a new age of modern data-informed redesigns that envisioned transformational changes to bus service. Since then, its success at engendering lasting ridership improvements has inspired sister redesigns across the country. Houston’s redesign followed a 25 percent decline in Harris County transit ridership over the previous decade. Rather than adjust its bus routes incrementally, METRO embarked upon a complete System Reimagining, treating its service area as a “blank sheet.” With support from Jarrett Walker + Associates, METRO transformed its hub-and-spoke network, which served downtown destinations better than emerging activity centers, to a gridded network that provides more uniform coverage city-wide. In addition to making routes less meandering and circuitous, the creation of logical transfer points improved system navigability. METRO also concentrated service onto high-ridership routes by improving both their weekday and weekend arrival frequency. Post-redesign, METRO was able to run equivalent weekend and weekday schedules on its high-frequency core. The result of this audacious reenvisioning was a more intuitive, effectual network that provided better access to jobs and opportunities across the city beyond peak hours. That the redesign was planned as cost-neutral, i.e., no additional funding to run the new service was required, is especially notable.
In total, service changes were substantial. METRO completely remapped almost two-thirds of the county’s local routes. The remaining third still received minor modification. The agency unveiled the new network overnight on August 16, 2015, the largest one-day service change ever enacted by a U.S. transit provider. Although the initial roll-out was bumpy, over time, it engendered sustained increases in transit ridership network-wide. Houston’s bus and light rail system experienced 4.5 million more boardings in the 11 months following the roll-out. Ridership boosts were especially significant on weekends, when improved route frequency helped unleash pent-up demand.
Though Houston’s is by no means the only successful redesign of the 2000’s and early 2010’s, its success has sparked excitement among transit agencies, helping them envision mobility improvements in their own regions. After Houston’s new network launched, SEPTA officials, for example, recognized that similar ridership improvements in the Philadelphia area might also be attainable. As Jon Orcutt, Director of Communications and Advocacy at the mobility foundation TransitCenter stated, Houston’s redesign “started a new trend in the transit industry.” Success stories like Houston’s are inspiring. When an agency embarks upon a redesign effort, however, they must determine what improvements will best expand service in their specific contexts. The next section explores the goals, objectives, and desired outcomes of past and ongoing redesigns.
Fixed Budgets Limit What’s Feasible…
Every network redesign shares one overarching goal: to best connect individuals and communities to destinations given constrained resources. But transit agencies have myriad tools at their disposal to realize this goal. Table 2 highlights some of the most common objectives voiced by transit agencies in those redesign efforts listed in Table 1. Whereas the goal of better service can be lofty and intangible, objectives provide substantive, measurable actions that providers can implement to realize this goal. The objectives I include here are taken from official agency publications. While they cover many of the measures agencies can take to improve service, they are neither necessarily mutually exclusive nor exhaustive of all possible network interventions.
Table 2. Redesign objectives stated publicly by transit agencies. These were collected via a survey of publicly accessible documents published by transit agencies.
| Stated Objective | Number of Redesigns |
| Increase midday service on weekdays, e.g.,
· Increase morning/afternoon weekday route frequency · Increase frequencies of routes serving job centers |
15 |
| Provide better route coverage, e.g.,
· Ensure residents are within walking distance of a bus stop with frequent service |
11 |
| Simplify routes, e.g.,
· Remove stops with low ridership · Re-route away from high-traffic streets · Increase bus stop spacing |
11 |
| Increase weekend, morning, and evening service, e.g.,
· Increase late night/early morning route frequency · Increase Saturday/Sunday route frequency |
10 |
| Streamline network, e.g.,
· Remove routes with high overlap · Eliminate alternate schedules · Reduce planned route deviations |
8 |
| Create better transit connections, e.g.,
· Time stops with commuter rail departures · Add stops near subway or light-rail stations |
7 |
| Add connections to new destinations, e.g.,
· Add stops near, e.g., job activity centers, healthcare centers, schools, and universities |
5 |
Three forms of intervention have proven most popular among recent redesign efforts:
- Simplifying routes, typically to reduce travel times and unforeseen traffic delays,
- Increasing midday service on weekdays, usually by adding additional arrivals to reduce waiting times and crowding at stops, and
- Extending route coverage, often to better connect residents to nearby destinations, minimizing walking distances and improving network accessibility.
Each of these interventions can improve the mobility afforded by the region’s bus network. However, given that agencies operate within restrictive budgets, not all objectives may be realizable simultaneously. Providers must determine, in conversation with constituents, which objectives deserve priority.
Many of the trade-offs agencies face can be described along one axis: improving system ridership versus improving system coverage. Both goals are correlated with beneficial outcomes but require opposing network design approaches. Systems designed for ridership maximization focus service along high-demand corridors. Users in busy, dense areas can expect frequent arrivals to popular destinations. Riders further from these corridors, however, must walk longer distances to their nearest stop and endure longer waits for the next bus. Conversely, systems designed for coverage maximization spread routes uniformly amid the service region. Regardless of their location, riders can reach a stop nearby. Users in dense areas, however, must wait longer for less frequent service on more crowded buses. Of the objectives listed in Table 2, adding connections to new destinations and improving off-peak-hour frequency generally support a coverage goal; streamlining the network and improving peak-hour frequency better support a ridership goal. Some objectives might support both goals. Adding better connections to commuter rail or subway connections, for instance, could improve the mobility of residents further from high-quality transit service while also improving the ridership of that high-quality transit service. For a visualization of these trade-offs, see transit consultant Jarrett Walker’s blog Human Transit.
To illustrate the trade-offs between ridership and coverage, the Metropolitan Atlanta Rapid Transit Authority (MARTA) drafted two concept plans during the early phases of its NextGen Bus Plan: a “Coverage Concept” and a “Ridership Concept.” The plans were not full proposals but illustrations of the potential network if one goal is prioritized over the other. MARTA shared the concepts with constituents as visual representations of the typical trade-offs in network redesign. The feedback MARTA received has helped inform their draft network, which focuses more so on improving ridership. Other regions’ proposed networks strike different balances. The Tri-County Metropolitan Transportation District of Oregon’s (TriMet’s) plan, for instance, prioritizes ridership in highly-populated walkable areas, and coverage for low-income and minority suburban communities. In other words, the concept priorities ridership in areas with high transit potential while championing equity for disadvantaged communities under-served by transit.
Within the goals of ridership and coverage, agencies have the opportunity to provide better service for those who rely on it most. Black and Brown communities and residents with disabilities or low income are statistically more likely to be frequent transit users than other populations, particularly because members of these communities often have less access to other transportation options like personal vehicles. Under Title VI of the Civil Rights Act of 1964, transit agencies are required to conduct equity analyses to ensure projects do not disproportionately negatively impact low-income riders and riders of color. However, most agencies make strides to actually advance equity in their redesigns. AC Transit, for example, includes equity as one of their redesign’s three guiding principles, particularly for seniors and low-income households. To better understand how its proposed network would affect historically marginalized communities, the Washington Metropolitan Area Transit Authority (WMATA) identified Equity-Focus Communities (EFCs), areas with high concentrations of people of color, people with disabilities, and people with low incomes. While iterating among redesign options, WMATA compared the predicted mobility of EFCs against that of other areas in the Washington, DC region to ensure its final plan improves service for these important users.
…But Agencies Still Imagine What’s Possible
Many redesign efforts (e.g., Pittsburgh Regional Transit (PRT), SEPTA, and MARTA) are cost-neutral, envisioning better service within existing operating budgets. These fiscal restrictions limit the magnitude of mobility benefits any redesign effort can achieve. These limitations force agencies to prioritize objectives and constituencies in ways that produce winners and losers. However, agencies often don’t implement redesigns in isolation: many providers frame their redesign initiatives as spokes in their larger long-term strategies to modernize service. For example, an agency might set a goal of improving average bus speeds. Rerouting buses may prove helpful to avoid busy intersections and left-hand turns across traffic. Combining this improvement with new bus-only lanes and improved signal timing schemes, however, could engender greater benefits. To improve bus service reliability, New York’s MTA is pairing its network redesign efforts with other interventions. These Bus Priority Projects, completed in partnership with the NYC Department of Transportation, include new bus lanes, transit traffic signal priority changes, and automated bus lane enforcement cameras on targeted corridors in all five boroughs. Agencies must leverage all the tools at their disposal to ensure redesigns create maximum benefit.

Figure 2. Bus lane on 149th St in the Bronx, NY installed by MTA and NYCDOT in 2020. The near-3-mile span includes traffic signal priority for transit vehicles.Credit: Marc A. Hermann, MTA New York City Transit. Creative Commons Attribution 2.0 Generic license.
Combined with issues presented by bus operator shortages and aging buses, limited funding restricts the magnitude of currently possible improvements. To plan for the future, many transit agencies have thus distinguished between what service they can provide with existing resources and the service they hope to provide in-future with additional funds. WMATA, for instance, distinguishes between its “Proposed Network,” which leverages currently available staff, buses, and capital, and its “Visionary Network,” which would require additional means to realize. Pittsburgh’s PRT redesign establishes a “Draft Network 1.0” and a “BLR +20% Proposal” to be adopted on a longer-term timeframe if revenue becomes available. Publishing loftier network visions can help constituents both recognize the restrictions their local agency faces and appreciate the potential benefits of additional public transit funding.
We Know Our Objectives. Now What?
Both determining a network redesign’s objectives and how best to modify service to meet those objectives is a complex endeavor. The Federal Transit Administration (FTA) publishes few resources to guide providers through the redesign process. However, transit agencies have learned from each other. The agencies included in Table 1 have largely approached their redesigns following similar steps. They typically begin by collecting system performance and travel demand data, then iterate between periods of route re-drafting and public comment. The seven most common phases of modern redesigns are listed below:
- Conduct current network market and performance assessments to ascertain where and when people wish to travel, understand how well the current bus transit network serves travel demand, and identify areas for improvement.
- Gather public comment on current network to better understand riders’ experiences and priorities.
- Create draft network plan to address opportunities identified in Steps 1 and 2.
- Gather public comment on draft plan to collect constituents’ reactions to proposed service changes.
- Create final plan to address feedback collected in Step 4.
- Acquire agency Board of Directors approval on final plan to ensure proposed service changes are in line with the agency’s goals, mission, and financial constraints.
- Implement new network in phases to allow time for stakeholders to plan for and respond to service adjustments.
Agencies might modify these steps to suit their contexts, commonly by adding additional stages of redrafting and outreach. The ultimate goal of a redesign plan is its adoption by the transit agency’s governing body, which will determine whether it successful addresses the needs and priorities of the public. However, an agency may overrule feedback or riders’ proposed changes due to time or budget constraints. In isolated cases, an agency might fully scrap their draft network in favor of a new version that better addresses constituents’ concerns. The MTA, for instance, released an initial Queens network draft plan in December 2019 but withdrew it from consideration in 2021 because of substantial public criticism and the onset of COVID-19 travel restrictions. The following sections explore the steps above in more detail, particularly how agencies leverage data to inform their redesigns, common approaches to public comment gathering, and the complexities of implementing a new network.
Modern Redesigns Use 21st Century Travel Data
Transit agencies in the past 20 years have increasingly leveraged big data in their redesign efforts. In particular, they have employed aggregated travel data to conduct travel demand flow analyses. This trend is strong in part because it has become easier and less expensive to obtain high-quality travel demand estimates. To better understand their region’s travel behavior as part of current network market assessments, transit agencies frequently collect some or all of the data listed in Table 3.
Table 3. Data sources transit agencies commonly employ during network redesign processes. Insights were collected via a review of publicly accessible documents published by transit agencies and their contracting partners.
| Data Source | Description | Importance |
| Geospatial demographic data | Details the number of people living within a given geography (e.g., census tract or block) as well as their demographic and socioeconomic characteristics (e.g., race/ethnicity, income, car ownership, and age). The U.S. Census Bureau updates these estimates annually via its American Community Survey. | Demographic information helps transit agencies better understand the people in their region, especially those who are more likely to rely on transit service. |
| Points of interest | Locations of common destinations such as employment centers, shopping malls, grocery stores, educational institutions, healthcare facilities, and recreational attractions, typically gathered from a diverse set of sources. | Points of interest may generate and attract travel demands that bus service might effectively serve. |
| Location-based services (LBS) data | Longitudinal personal location data collected via smart phone applications that use Wi-Fi, cellular networks, or Bluetooth. Aggregated location-based services data can be purchased from third-party sources such as StreetLight, who clean and anonymize the data. | Location-based services data provides estimates of where people travel, when, and how. This data can help agencies assess broader travel demand patterns in their region. |
| Travel survey data | Travel data gathered first-hand from community members often online, at bus stops, or during community events. Questions might ask about recent transit trips or the survey taker’s travel patterns in general. | Though it can be expensive to collect, survey data can provide more detailed information than LBS data, including information about the trip-maker and their household, e.g., the purpose of a given trip, how frequently they make the trip, and if they travel with other people. Transit agencies can modify survey questions to suit their needs. |
| Road network information | Locations of all local roads, their speed limits, and whether they are traversable by bus. Agencies can freely collect this information from OpenStreetMap, an open license mapping platform. | Road network information can help agencies determine optimal busing paths and set bus stop locations. |
Aggregated travel data is powerful, able to provide transit agencies meaningful insights into their region’s mobility. However, its shortcomings must also be noted. Location-based services data in particular can describe when, where, and how people travel. However, it cannot explain why a person makes a trip, how they balance trade-offs between modes or routes, or how their trip-making might change with access to better transit service. Finally, it cannot capture trips not taken – the difference between latent travel demand and realized travel demand. Only travel surveys and one-on-one conversations with constituents can provide insights into a trip taker’s decision-making.
Nevertheless, travel demand estimates help agencies pinpoint opportunities to better align their service with the travel needs of their region. When agencies combine this data with current bus timetable, ridership, and speed information, they can form a fuller picture of the quality of bus service they currently provide. Agencies will often publish their findings in “existing conditions” reports filled with maps and visualizations that illustrate the region’s current state of travel. Jarrett Walker + Associates in particular has compiled compelling visualizations to describe the regions of Portland, Miami, and those of other redesigns for which it has provided consultant services. By expending the time to form a complete understanding of their region early on, agencies can better position themselves to make informed redesign decisions.
Public Outreach, Public Outreach, Public Outreach
Data is not just ridership figures, network characteristics, and population estimates. It’s also the lived experiences of those people who use public transit to reach their jobs, schools, friends, and family. When planning service, no substitute exists for the insights transit agencies can gather from the individual people who use it. For example, typically how late is the bus? How crowded? How convenient is the bus transfer? Does waiting at the bus stop feel safe? Is there an important destination to the community that no bus reaches? Perhaps the most important question the public can answer: does the bus help me reach my destination quickly, safely, and reliably? Agencies can collect public comment in myriad ways: project webpages, social media, hearings and meetings with communities and elected officials, phone calls, pop-up events at bus stops and neighborhoods across the region, and media advertisements, among many other strategies.
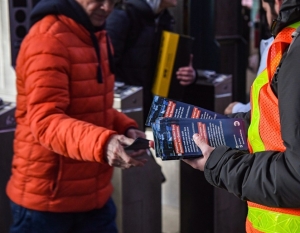
Figure 3. MTA customer outreach in Jackson Heights to gather feedback on Queens bus network redesign draft plan in December 2019. Credit: Marc A. Hermann / MTA New York City Transit. Creative Commons Attribution 2.0 Generic license.
Several themes emerge when dissecting agencies’ public outreach efforts. First, providing many diverse outreach opportunities matters to reach as many people as possible. Hosting events at multiple locations and times of day, providing print advertisement materials in multiple languages, and distributing surveys that residents can fill in print or online can all help reach constituents where and as they are. During the course of its redesign, LA Metro, for example, made more than 10 million “touchpoints” with county residents, including more than 100 public events, 12,000 survey responses, and more than 150 presentations to stakeholder groups. To extend the reach of their community engagement, agencies often coordinate with special interest groups (e.g., disability advocacy groups, business groups, and labor organizations) that can provide insights into the priorities and needs of particular communities.
Second, agencies can help riders understand potential service changes by providing them intuitive maps and other tools to explore. In addition to static maps describing service changes in particular neighborhoods, most agencies provide interactive maps and route planning tools to help users understand how their own trips might change. Remix by Via Transportation provides the transit routing functionality many agencies use for this purpose. Generally, a user is able to input their origin, destination, and time of departure into the routing tool and compare how their best trip option compares given current versus proposed transit service. An agency will often embed this tool into their website. Providing this functionality to riders can help them understand how systemic network changes will impact them individually.
Finally, reaching out to bus operators can provide agencies insights from the driver perspective. Operators can speak to the complexities and shortfalls of their routes: long traffic signals, challenging left turns across multiple lanes, and narrow roads difficult to traverse, for example. To provide them fora to voice concerns with proposed changes, WMATA held “Preview Parties” for its bus operations staff. Through these events, the agency was able to gather valuable feedback on route length, traffic congestion, and the need for longer breaks. Reaching out to operators can both help improve their quality of life and establish goodwill with agency leadership.
Beyond internalizing feedback provided by constituents, interest groups, and operators, agencies have an opportunity to show how that feedback has informed proposed service changes. This is a chance for agencies to promote transparency in their redesign processes. To accomplish this feat, SEPTA published a data table describing for each bus route under consideration, the comments they received from the public and how those comments influenced proposed route changes. Denver’s RTD actually responded in print to individual comments they received – 1,600 in total! (These SEPTA and RTD comments are no longer available online.) This dedication to feedback helps establish trust with community members and serves as an example for public dialogue that other transit agencies should follow whenever feasible.
Redesign Methodologies Are Often Opaque
Once agencies identify the needs of their region and determine the objectives of their redesign, they can begin redefining service. Drafting route alternatives is a complex task. Though most agencies do not publish details of their redesign methodologies, the academic literature is rife with proposed mathematical solutions: heuristics, algorithms, and mathematical programming approaches. (See Iliopoulou et. al., (2019) for a recent overview of these techniques.) Agencies can employ more mathematical or more collaborative network redesign approaches. Because the data science, computer programming, and mathematics expertise required to carry out a mathematical approach can be prohibitive, agencies widely employ the services of private consultants to draft network alternatives rather than produce them in-house. Multiple firms have extensive experience redesigning transit networks in the U.S. Their services are highly demanded. For example Cambridge Systematics has partnered with LA Metro, WMATA, and MBTA. Nelson / Nygaard has provided services for SEPTA and King County Metro. Jarrett Walker + Associates boasts perhaps the largest project portfolio, including but not limited to projects for Houston METRO, IndyGo in Indianapolis, the City of Richmond, VA, and a number of international cities: Auckland, New Zealand; Edmonton, Canada; and Dublin, Ireland.
Boston MBTA’s redesign in partnership with Cambridge Systematics and Arup provides one of the best documented algorithmic network design methodologies, outlined by Baumgartner et al. (2023). Though the MBTA’s approach is not necessarily representative of those of all recent redesigns, I discuss it briefly to provide you a better understanding of the tools and steps that might be required. The MBTA elected to completely reimagine their high-frequency network, consisting of routes with 15-minute frequencies or better 20 hours per day, seven days per week. Consultants began by creating “Bus Analysis Zones” (BAZs), census tracts aggregated to form geographies approximately half a square mile in area. Using StreetLight travel data, they estimated trip matrices that report the number of trips between each pair of BAZs at different times. Between each pair of BAZs, they used road network information and shortest path algorithms to identify possible busable corridors. Using sampling techniques, they then compiled corridors into potential full networks that connect every pair of BAZs – approximately 100,000 possible networks in total. After filtering networks that contained redundancies, they scored each network according to its expected ridership given by its trip matrices, required resources, and the number of low-income and minority BAZs it serves effectively. The project team mapped the 20 highest scoring networks and evaluated them. The approach of the MBTA, Cambridge Systematics, and Arup balances mathematical tools with expert guidance. Rather than generate a single best network, they used algorithms to enumerate potential alternatives upon which the team could discuss and improve.
The MBTA’s redesign is one of few cases in which a transit provider and their consultant team use an algorithmic approach and fully describe it in publicly accessible documents. Though I can only surmise, many agencies may elect to disclose partial or no such information for multiple reasons: their methods are built upon proprietary data or techniques, public disclosure would open them to lawsuits, or their strategies are highly technical and challenging to clearly explain. To provide transparency and accountability, however, I challenge agencies to follow the MBTA’s example and clearly outline their redrawing strategies whenever possible. Doing so will help establish trust with constituents and foster innovation within the transit planning industry.
From Pen to Pavement
No part of a transit network redesign is easy. But implementing a new network especially requires coordination and communication among multiple sets of stakeholders. First, riders must be adequately forewarned of changes to their routes. Bus operators, dispatchers, and other agency staff must be properly trained on adjusted routes. Infrastructure such as signage, routing maps, and potentially, bus stops must be updated or constructed. Though Houston implemented all its service changes overnight, most agencies have since adopted phased implementation plans, with networks realized in stages as funding and workforce become available. This strategy also allows agencies to incorporate learnings from previous roll-out stages to improve communication moving forward. For example, LA Metro implemented its NextGen Bus Plan as a series of “shake-ups.” Its first occurred in June 2021. But confusion around routes, stop times, and fares aggregated riders. In response, CEO Stephanie Wiggins formed a working group to devise communication strategies for upcoming roll-outs. Through broadcast alerts across social and print media, in-person outreach at bus stops, and updated signage, the following September and December shake-ups ran smoothly. Once an agency implements its updated bus network, its years of hard work near an end. All that remains is to monitor updated routes, tweaking them if necessary based on post-launch performance and rider feedback. Bus networks are ever-evolving. As cities and the people within them change, transit service must respond. Though a redesign initiative might wrap up, an agency’s mission of improving service never ends.
Diving Deep: A Case Study on MTA’s Bus Network Redesign in Queens, NY
We’ve completed our whirlwind exploration of recent bus network redesigns in the U.S., touching on their impetuses, their methodologies, and their implementations. We’ve highlighted the experiences of particular agencies to illustrate concepts along the way. One recurring theme that’s more challenging to demonstrate, however, is the role that regional context plays in any agency’s approach; any redesign must start and end with the needs and desires of the community it serves. To show how context shapes a redesign effort, I devote the rest of this article to one redesign nearing completion: the MTA’s bus network restructuring in Queens, NY. I start by describing the borough itself and the current state of its bus service. I then recount the MTA’s redesign process, culminating in its addended final draft network, which will be implemented starting June 2025. Finally, I show the results of analyses I conducted that describe how that proposed network would change mobility for the borough’s residents.
Queens is a highly diverse, growing county with a large reliance on transit service. It boasts the second largest population of all five New York City boroughs, with residents living in a diverse urban landscape. Its 2.3 million residents reside in everything from high-rise apartment buildings in Forest Hills, Flushing, Astoria, and Jackson Heights to single-family homes in South Ozone Park, Glen Oaks, and Queens Village. Its population is also growing. Between 2010 and 2020, the county added 150,000 residents and 33,000 housing units. With 47 percent of its currents residents born outside the U.S. and many enclaves of immigrant communities, Queens has long been called one of the most ethnically and linguistically diverse places in the world. Many of its recent immigrants are low-income (see Figure 4) and less likely to own personal vehicles.
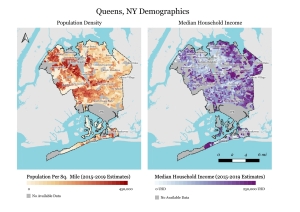
Figure 4. Population density and median household income by block group in Queens, NY. Data from U.S. Census Bureau American Community Survey (2015-2019). Map made with QGIS by Steven Parks.
Providing high-quality bus service in Queens is challenging. At 109 square miles in area, Queens has by far the largest land mass of any borough in New York City. Despite its size, the county has fewer subway and commuter rail connections per capita than any other borough, leaving residents dependent on bus service. In fact, with 800,000 average weekday bus users, Queens residents are more reliant on bus service than in most other boroughs. However, these residents are not equally served by transit. The Rockaway Peninsula and eastern Queens have relatively sparser transit service, with few reliable, time-efficient transit options to reach jobs and other destinations. Though Queens’ transit needs are great, the reliability of its bus system has been plagued by some of the slowest bus speeds of any U.S. city, which MTA attributes to increased traffic congestion in recent years and the short spacing between its bus stops. Even before the COVID-19 pandemic, bus ridership in Queens suffered.
Recognizing that bus service must improve in Queens and citywide, the MTA launched its Bus Network Redesign project in 2018 with plans to redefine bus routes in all five boroughs. This redesign, the agency’s first in over 100 years, is well underway. The MTA launched its redesigned Staten Island Express bus network in 2018 and its amended Bronx local bus network in 2022. Its Queens redesign initiative launched officially in April 2019. Its purview includes all local routes (denoted by a “Q” route name label), express routes that connect Queens to Manhattan (represented with a “QM” or “X” label), and several other routes adjoining Queens to Brooklyn (marked by a “B” label). The MTA established four objectives for its Queens network redesign in conversation with transit users:
- Improve network simplicity and easy-of-use,
- Maximize connections within Queens and among boroughs,
- Reduce route travel times, and
- Increase bus arrival reliability.
Seven months after project launch, the MTA published a first draft of a redesigned Queens network. It proposed sweeping changes to service, reminiscent of Houston’s complete network restructuring in 2015. In fact, then MTA Transit President Andy Byford called the proposal a “true reimagining” of existing service that aimed to provide simplicity, reduce route redundancies, and improve travel speeds, particularly by increasing bus stop spacing system-wide. The draft was cost-neutral, identifying targeted improvements but cutting some less-utilized service. Though MTA staff lauded the plan, the public was skeptical. Local residents particularly worried that proposed changes, including the elimination of closely-spaced stops and five existing routes, would reduce transit access in areas with already low connectivity. That the draft plan established a new route naming system fueled additional confusion. The plan was so divisive that all 15 Queens city councilmembers openly opposed it.
At the onset of the COVID-19 pandemic, the MTA paused its redesign efforts for 18 months, returning in Spring 2021 to release its New Draft Plan. Reflecting 11,000 public comments on the original draft, the updated plan suggested that new service be built atop the existing network rather than reenvisioned completely. This new draft scrapped most changes proposed in the original plan. For example, it maintained the existing bus network’s route naming scheme. Moreover, proposed increases to bus stop spacing were retained, but lessened, with an average spacing of 1,100 feet, up from 800 feet currently. The plan’s hallmark was the improvement of high-frequency routes. “Rush” routes, among other new route designations, would quickly transport riders from outer Queens neighborhoods to Long Island Rail and subway stations. Recognizing that retaining local service, a key criticism of the original draft, while improving efficient cross- and inter-borough connections would require an infusion of funding, MTA Chairman and CEO Janno Lieber promised to earmark new funds for the redesign. Upon release, the new proposal received a slightly warmer reception than its predecessor. Queens Borough President Donovan Richards’s statements were reflective of the tempered optimism among many residents: “When you look at what the MTA has come back with, at least what I have seen thus far, you can tell that they definitely listened to communities.”
After an additional period of public feedback, the agency incorporated further changes to form its Proposed Final Plan, released in December 2023. The plan leverages $30 million to expand the reach of its “all-day network,” bus routes with 10-minute spacing from 6am to 9pm on weekdays, and increase the number of local routes from 83 to 91 (though some “new” routes are merely combinations of existing routes to be phased out). The MTA claimed that subsequent accessibility improvements would be large, with the percentage of Queens residents living within a quarter-mile of a frequent-network bus stop increasing from 60.1% to 68.9%. Most notably, the plan proposed a new express route, the “QM65,” which would connect southeast Queens to lower Manhattan, but the discontinuation of the “QM3” express route, which runs from Glen Oaks to Midtown Manhattan and currently sees low ridership.
The MTA released its Proposed Final Plan in December 2023, followed by half a year of public outreach that culminated with a public hearing in July 2024. Feedback was mixed. Residents voiced excitement about the increased mobility afforded by the new QM65 express route. However, many were concerned that the final plan otherwise neglects the access of outer neighborhoods such as Far Rockaway and Glen Oaks. Finally, some residents maintained concerns that the increased spacing of bus stops, a consistent proposal among all Queens redesign drafts, would limit the mobility of seniors and riders with disabilities.
The MTA’s release of its Final Plan Addendum in December 2024 marks the final entry to its draft portfolio. With 94 local and 30 express routes, it strays from the original final plan via only minor adjustments. To show its receptiveness to constituent feedback, the report – publicly available online – includes a list of comments received during Proposed Final Plan outreach with note describing how each is addressed. With respect to Queens’ existing bus network, the addendum plan envisions a 21st century network with several persistent themes:
- A more legible route hierarchy that clearly distinguishes between high-ridership express routes to major job centers and local routes to community destinations,
- Increased stop spacing systemwide,
- New Rush routes that quickly shuttle riders from the borough’s outer neighborhoods to the closest subway and rail stations, and
- Simpler service achieved by combining, splitting, and straightening routes.
On January 29, 2025, the MTA Board unanimously approved the addended final plan. Its implementation is slated to begin this summer in two phases. During Phase One from June 27 to 30, 88 routes will be adjusted, added, or discontinued. During Phase Two from August 29 to September 2, changes to the remaining 39 routes will be applied. Figure 5 maps the alterations to each route in the redesign’s scope. In the interim, MTA is working to broadcast route changes to the public. They are currently updating bus stop signage and publishing online tools, including a future route planning tool and interactive transit maps hosted by Remix, to help riders understand upcoming service adjustments. Though the addendum is Board approved, the MTA stresses that public outreach is ongoing: they plan to present at community board meetings and staff pop-up events to provide one-on-one engagement with riders. Overall, MTA and New York City officials are optimistic that Queens’ new network will improve travel for all those who rely on it. “Starting this summer,” said NYC Department of Transportation Commissioner Ydanis Rodríquez, “bus riders in Queens will get to experience an enhanced, efficient, and modern bus network, holistically designed for the future, not the past.”

Figure 5. Proposed MTA bus lines serving Queens, NY in Proposed Final Plan Addendum. Note that most routes will experience some service changes to stop spacing, frequency, or traveled path, which are not reflected above. Data from Metropolitan Transportation Authority GTFS. Route status determinations were made consulting Proposed Final Plan Addendum Route Conversion Chart and Project Phasing Guide. Map made with QGIS by Steven Parks.
That these proposed network changes will create an “enhanced, efficient, and modern” bus system is hard to accept or dispute by consulting service alterations described in written form alone. To help visualize how service changes could impact mobility in Queens, I have conducted a short accessibility analysis. I use it to show how residents’ abilities to reach destinations might change under the addended final plan. Accessibility is one measure of a transit network’s effectiveness. Given an agency’s planned service, accessibility describes how many destinations a rider can reach within a given duration of time. More broadly, these analyses address questions such as “How many jobs can the typical resident reach within 30, 60, or 90 minutes?” “Where in the region is transit most useful to reach schools, hospitals, or grocery stores?” “Where is it less useful?” “How many fewer destinations are reachable on Sundays than on weekdays?”
To track changes to accessibility afforded by the Proposed Final Plan Addendum, I plot the number of jobs in the larger New York City metropolitan region accessible to every location in Queens within a 90-minute walking or transit trip. I consider MTA bus, subway, and Long Island Rail Road lines plus bus routes operated by neighboring Nassau County in the analysis. My modeling scheme allows myriad combinations of trip modes. A trip might comprise, for example, a walk from origin to destination; a bus trip with one, two, or more transfers; or a bus trip to and from the subway. I compare accessibility afforded by current transit service in the New York City area, which includes Queens’ current bus service, to that afforded by current transit service but considering the MTA’s Final Plan Addendum. This comparison allows us to directly relate accessibility afforded by current bus service to that under proposed Queens bus service. I conduct the analysis at two times of day: weekday mornings at 8am, a peak travel hour, and Sundays at 12pm, an off-peak travel hour. Only transit service available at these specific departure times can be used to complete routes.
Before proceeding, it is important to note that these analyses are illustrative, but not comprehensive. For example, I consider only isolated times of day rather than all hours of the week, I look only at job accessibility, not accessibility to all types of destinations, and I assume trip-takers have full mobility and can access all types of transit service. Finally, the analysis only considers planned bus service, whereas transit trips in reality might be impacted by traffic congestion, bus crowding, or other factors. Nevertheless, our brief analysis can help describe larger transit mobility trends in Queens. The results of our analysis are visualized in Figure 6.
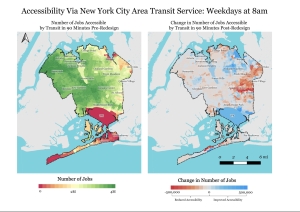

Figure 6. Accessibility to jobs pre-redesign and under Proposed Final Plan Addendum.
Left-side plots show the numbers of jobs accessible in New York City metropolitan area from each block group in Queens, NY using existing NYC area transit service leaving (top left) weekday mornings around 8am and (bottom left) Sunday afternoons around 12pm. Right-side plots show changes in numbers of jobs accessible under the Proposed Final Plan Addendum for these same time periods. I consider 90-minute transit trips with a maximum 30 minutes of walk time and a 30-minute time departure window centered at the reported time. Data from Metropolitan Transportation Authority GTFS, Nassau Inter-County Express Bus GTFS, LEHD Origin-Destination Employment Statistics (2021), and OpenStreetMap. Routing conducted using Rapid Realistic Routing with R5 (r5r) transit routing package. Map made with QGIS by Steven Parks.
Each subfigure in Figure 6 shows two plots. The left-side plots are read as follows: the color of any location in Queens denotes the number of jobs from that location that can be reached in 90 minutes in the New York City metropolitan area using existing transit service. Areas where more jobs can be reached are shown in green. Areas from which fewer jobs are accessible are shown in red. The right-side plots illustrate changes in transit service afforded by the Final Plan Addendum. Blue shades indicate that the number of jobs accessible would increase, i.e., accessibility would improve, and red shades indicate that the number of jobs would decrease and accessibility would worsen.
The analysis leads to several observations. First, current transit service on both weekday mornings and Sunday afternoons appears most effective in west and central Queens. Lower and Midtown Manhattan are key job centers, and subsequently, neighborhoods in Queens closest to Manhattan enjoy the highest accessibility to jobs. Neighborhoods in southern, eastern, and northern Queens are slightly more disconnected. Second, accessibility under current service tends to be slightly higher during peak hours on weekdays than at other times, though this difference appears subtle. I note that analyses at different times of day, e.g., weekday afternoons and Sunday mornings, were also conducted. I found commensurate accessibility on weekday afternoons as mornings and on Sunday evenings as afternoons.
Considering accessibility post-redesign, we can see that mobility changes on both days are neighborhood-specific, with northeast and southeast Queens enjoying improved service, but service from eastern Queens worsening, likely due to the elimination of the QM3 express route. Service changes also tend to slightly reduce accessibility from the Rockaway Peninsula. Though the MTA is making accessibility improvements by increasing bus frequency, adding the QM65 express route, and placing several additional local routes, mobility is perhaps lessened by the increases in stop spacing and the discontinuation of several low-ridership local routes. Ultimately, even with an infusion of additional funding, the Final Plan Addendum produces winners and losers.
As I mentioned, this accessibility analysis is not comprehensive. But I hope it illustrates how bus routes function as a system, affecting the mobility of the entire region they serve. It is one of many tools route designers can leverage to better understand how service changes could impact travel. Ultimately, however, service must respond to the needs of users. As the MTA implements its Final Plan Addendum and transit riders in Queens respond to it, the bus service visualized here is sure to change. Throughout its 5-year redesign effort, in fact, change has proven the only constant. The MTA has rescinded plans, revisited the drawing board, retracted changes, and injected new capital to expand what improvements are possible. Though concerns over service changes remain, the MTA has demonstrated its willingness to iterate – again and again. Good bus service is worth getting right.
How Do You Fit In?
Many of the modern bus network redesigns we’ve discussed have followed similar progressions: they have selected comparable objectives, followed parallel timelines, and employed one of a handful of consultants to support them along the way. The similarities among these redesigns demonstrate how transit agencies learn from each other, building upon institutional knowledge to deliver better products. But transit agencies don’t experience transit service: you do. Providers can optimize a bus system in its totality, but it’s individual riders who catch the bus every morning for work, every Saturday for a weekly grocery run, and every now and then to visit their friends or family. Transit agencies thus have a responsibility to listen to their constituents’ needs, to build trust among their communities, and to deliver a system that best serves them with the resources they’ve been allotted. The public, you and I, have an opportunity. Whether your local transit agency is systematically overhauling service or just routinely adjusting timetables, it’s your feedback and engagement that will make service a little better. Transit agencies across the U.S. are feeling great pressure to provide vital mobility with ever-shrinking resources. Compromises will inevitably exist when determining how service will evolve into the future. But by providing your opinion and insight, you can help ensure that those resources serve you and people like you as effectively as possible.

