Safe Streets for All Allocations Heading into Reauthorization
Heading into the spring, the Notice of Funding Opportunity (NOFO) will likely be released for the final funding round of Safe Streets for All (SS4A) under the Infrastructure Investment and Jobs Act (IIJA). Over the past four funding rounds (FY22-FY25), around $3.9 billion has been awarded for planning and demonstration grants and implementation grants. Legislation proposed in September by Steve Cohen (D-TN), the Safe Streets for All Reauthorization and Improvement Act, would authorize an additional $5 billion for program and to shift a greater percentage of funding dollars towards the implementation portion of the grants. As SS4A heads into its final funding year under IIJA, lawmakers at both the federal and local levels should consider how the federal program can continue to influence safety culture at the local level and the appropriate distribution of funds between planning and implementation for safety focused programs.
The Safe Streets for All Grants are focused on eliminating roadway fatalities and injuries for all roadway users, including pedestrians and cyclists. Safe street interventions identified in action plans developed with planning grant funding or deployed through implementation grants include roundabouts, updates to intersection infrastructure, sidewalk enhancements, and resources for emergency responders. The Safe Streets for All Grants are divided into two grant categories: Planning and Demonstration Grants, and Implementation Grants. Planning and Demonstration Grants are utilized by awardees to develop action plans to improve roadway safety while Implementation Grants are utilized by awardees to deploy safety interventions and strategies identified in action plans.
Eligible grant activities categorized as Planning and Demonstration Grants include developing a new comprehensive safety action plan or updating and enhancing road safety plan to meet the SS4A criteria. Supplemental safety planning actions can also be taken which include road safety audits, data collection and safety analysis, progress reporting, stakeholder engagement, and roadway safety planning. While many of the planning and demonstration grants are directed at planning activities, this category of the grant also includes demonstration activities to support safety action plans. Demonstration grants can be utilized on quick-build infrastructure projects which are temporary, flexible projects designed to pilot a safety intervention like plastic delineator posts or movable speed bumps. Under SS4A, quick-build projects are conducted as feasibility studies, soliciting feedback for potential future permanent implementation. Demonstration activities also permitted include pilots for new technologies, pilot programs for behavioral change, and engineering studies.
Communities ready to implement projects and strategies can apply for implementation grants. In order to receive an implementation grant, recipients must identify projects from an existing action plan. If their action plan is more than three years old or does not apply to all roadway users, applicants must update their plan. Examples of implementation activities include enhanced signage, road markings, and lighting; traffic calming measures through road design changes and enforcement; and road safety treatments. Implementation grant awardees may also utilize funds for planning, design, and development of interventions and for supplemental planning and demonstration activities.
The Safe Streets for All Grant program was authorized through the Infrastructure Investment Jobs Act (IIJA) for FY22-FY26, and $1 billion appropriated for each year for funding. Funding for SS4A was provided as part of advance appropriations in Division J of IIJA and expires in September. If an extension of IIJA becomes necessary and only includes funding for those programs funded by the Highway Trust Fund, then future funding for Safe Streets for All will become subject to annual appropriations.
Between the FY24 and FY25 funding rounds, changes were made to some of the grant application requirements and evaluation criteria due to the change in Administration. These changes included changing the definition of underserved communities, removing equity-based requirements, and prioritization of projects within communities with high marriage and birth rates and projects supporting local opportunity zones.
FY26 is the final year of the program under the current authorization. The Notice of Funding Opportunity for FY26 is not out yet but based on previous application cycles, it will likely be released in spring and will close in the early summer. For the FY26 funding round, USDOT is planning to restrict the usage of speed cameras as a funded safety intervention.
In September 2025, Representatives Steve Cohen (D-TN), Brian Fitzpatrick (R-PA), and Robert Garcia (D-CA) introduced the Safe Streets for All Reauthorization and Improvement Act to reauthorize the Safe Streets program from FY27 to FY31 at $5 billion. This would be an extension of the IIJA’s initial five year authorization of the program. The proposed bill would also decrease the minimum set-aside for planning grants funding to 20 percent as opposed to the current 30 percent and initial 40 percent. Organizations that have spoken in support of the reauthorization of SS4A include AARP, Trust for Public Land, and the Sierra Club. The individual bill was referred to the Subcommittee on Highways and Transit. If the bill moves forward, it most likely be as a part of the consolidated surface transportation reauthorization package.
When IIJA passed, there was a minimum set aside of 40% for planning and demonstration grants. However, Congressional actions through the March 2025 CR pushed this minimum down to 30 percent for the FY25 funding round. This legislative change reflected calls from advocates for a greater portion of the funds to be dedicated to infrastructure implementation. Organizations like Smart Growth for America also encouraged applicants to utilize planning grants for demonstration activities. Despite the 40 percent set aside in initial funding rounds, USDOT did not receive enough eligible planning applications to hit the $400 million mark each year.
The following charts show the distribution of grants and funding between planning and demonstration grants and implementation grants within funding years.
In FY22, 92.8% of awarded projects were for planning and demonstration, while 7.2% of projects awarded were for implementation. In terms of percentage of funds, 26.45% was dedicated to planning and demonstration projects, and 73.55% was dedicated to implementation projects.
| FY 2022 | Total Awards | Total $ |
| Planning & Demonstration | 474 | $212,191,762.20 |
| Implementation | 37 | $589,969,256.34 |
| Total | 511 | $802,161,018.54 |
In FY23, 92.3% of the number of awarded projects were for planning and demonstration, while 7.7% of projects awarded were for implementation. Planning activities are much less expensive than implementation, so in terms of percentage of funds, 32.5% was dedicated to planning and demonstration projects, and 65.7% was dedicated to implementation projects.
| FY 2023 | Total Awards | Total $ |
| Planning & Demonstration | 572 | $290,667,631 |
| Implementation | 48 | $605,050,348 |
| Total | 620 | $895,717,979 |
In FY24, 90.14% of awarded projects were for planning and demonstration, while 9.86% of projects awarded were for implementation. In terms of percentage of funds, 35.03% was dedicated to planning and demonstration projects, and 64.97% was dedicated to implementation projects.
| FY 2024 | Total Awards | Total $ |
| Planning & Demonstration | 640 | $434,890,481 |
| Implementation | 70 | $806,600,340 |
| Total | 710 | $1,241,490,821 |
In FY25, 87.14% of awarded projects were for planning and demonstration, while 12.86% of projects awarded were for implementation. In terms of percentage of funds, 30.1% was dedicated to planning and demonstration projects, and 69.9% was dedicated to implementation projects.
| FY 2025 | Total Awards | Total $ |
| Planning & Demonstration | 454 | $295,723,850 |
| Implementation | 67 | $686,508,148 |
| Total | 521 | $982,231,998 |
Across the past four funding rounds, 89.36% of awarded projects were for planning and demonstration, while 10.64% of projects awarded were for implementation. In terms of percentage of funds, 31.45% of funding dollars were dedicated to planning and demonstration projects, and 68.55% of funding dollars were dedicated to implementation projects.
| Year | P # | Planning $ | I # | Implementation $ | Total # | Total $ |
| 2022 | 474 | $212,191,762.20 | 37 | $589,969,256.34 | 511 | $802,161,018.54 |
| 2023 | 572 | $290,667,631 | 48 | $605,050,348 | 620 | $895,717,979 |
| 2024 | 640 | $434,890,481 | 70 | $806,600,340 | 710 | $1,241,490,821 |
| 2025 | 454 | $295,723,850 | 67 | $686,508,148 | 521 | $982,231,998 |
| Total | 214 | $1,233,473,724.2 | 222 | $2,688,128,092.34 | 2362 | $3,921,601,816.54 |
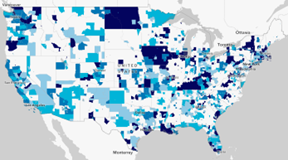
Interest in SS4A grants is widespread and communities in every state in the nation have benefited from grant funding. The following maps display the geographic locations where SS4A grants have been awarded. The differing shades of blue indicate the fiscal year in which the grants were awarded, moving from darker to lighter shades of blue as the years progress.
Total Geographic Coverage of FY22-25
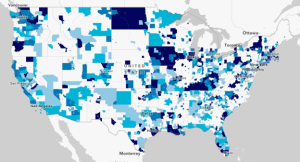

Source: All Years’ SS4A Grant Awards | US Department of Transportation
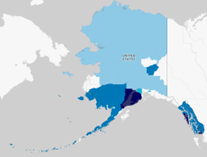
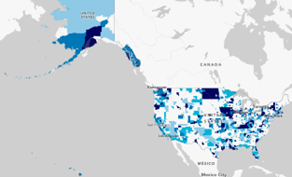
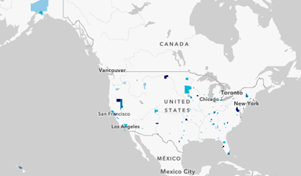
Geographic Coverage of Planning and Demonstration versus Implementation FY22-FY25
| Planning and Demonstration | Implementation |
 |
 |
 |
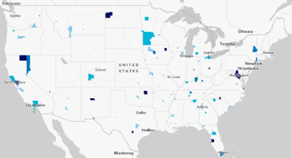 |
Source: All Years’ SS4A Grant Awards | US Department of Transportation
Across funding rounds, a significant percentage of awards went to planning and demonstration grants, and the majority of total dollars went towards implementation grants. Each year, there was a very slight shift towards a greater percentage of total grants going towards implementation, with while about 93% of FY22 grants were for planning and demonstration. Since planning and demonstration projects are typically cheaper than implementation projects, a greater portion of the total funding is directed to implementation projects despite the fact that a greater portion of total awards are given to planning and demonstration projects. Across funding years, around 30% of total dollars have gone towards planning and demonstration while around 70% of total dollars have gone towards implementation. Year over year, the total dollar distribution has remained relatively close to the 30/70 split, both before and after the legislative change shifting from a 40% set aside to a 30% set aside for planning grants.
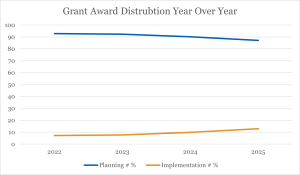
| Year | Planning # % | Implementation # % |
| 2022 | 92.8 | 7.2 |
| 2023 | 92.3 | 7.7 |
| 2024 | 90.14 | 9.86 |
| 2025 | 87.14 | 12.86 |
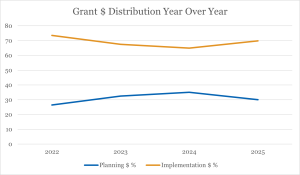
| Year | Planning $ % | Implementation $ % |
| 2022 | 26.45 | 73.55 |
| 2023 | 32.5 | 67.5 |
| 2024 | 35.03 | 64.97 |
| 2025 | 30.1 | 69.9 |
As the Safe Streets for All Grant program heads into its final year of authorization under the IIJA, communities will have a final opportunity to apply for grants to update or develop safety action plans, conduct demonstration activities, and implement safety improvements. Each funding year, around 90% of the grants awarded have been classified as planning and demonstration. At the same time, around 31% of the total funding dollars have been dedicated to planning and demonstration grants. It is also important to note that awards classified as implementation projects can include planning and demonstration activities, and some planning and demonstration grants have infrastructure elements through quick-build projects. The legislative change to lower the funding distribution minimum to 30 percent was largely reflective of the actual percentages that were being achieved for planning and demonstration grants.
Bringing down the minimum set aside to 20 percent in a potential reauthorization of the program could potentially shift a greater percentage of funds towards implementation grants. However, this is also contingent on communities applying for implementation projects. Given the large number of planning and demonstration grants delivered over the past four funding rounds, there should be a pipeline of potential projects eligible for funding. Looking at the geographic distribution of grant funding indicates that a higher percentage of localities across the country have been recipients of planning and demonstration grants. The implementation grants, given their smaller percentage of total awarded projects, have had a more limited geographic impact. Reauthorization of the program could entail an expanding of this infrastructure map. However, even if the program is not reauthorized, large number of safety action plans developed through the first authorization can still translate into infrastructure improvements depending on the availability of local funds.

