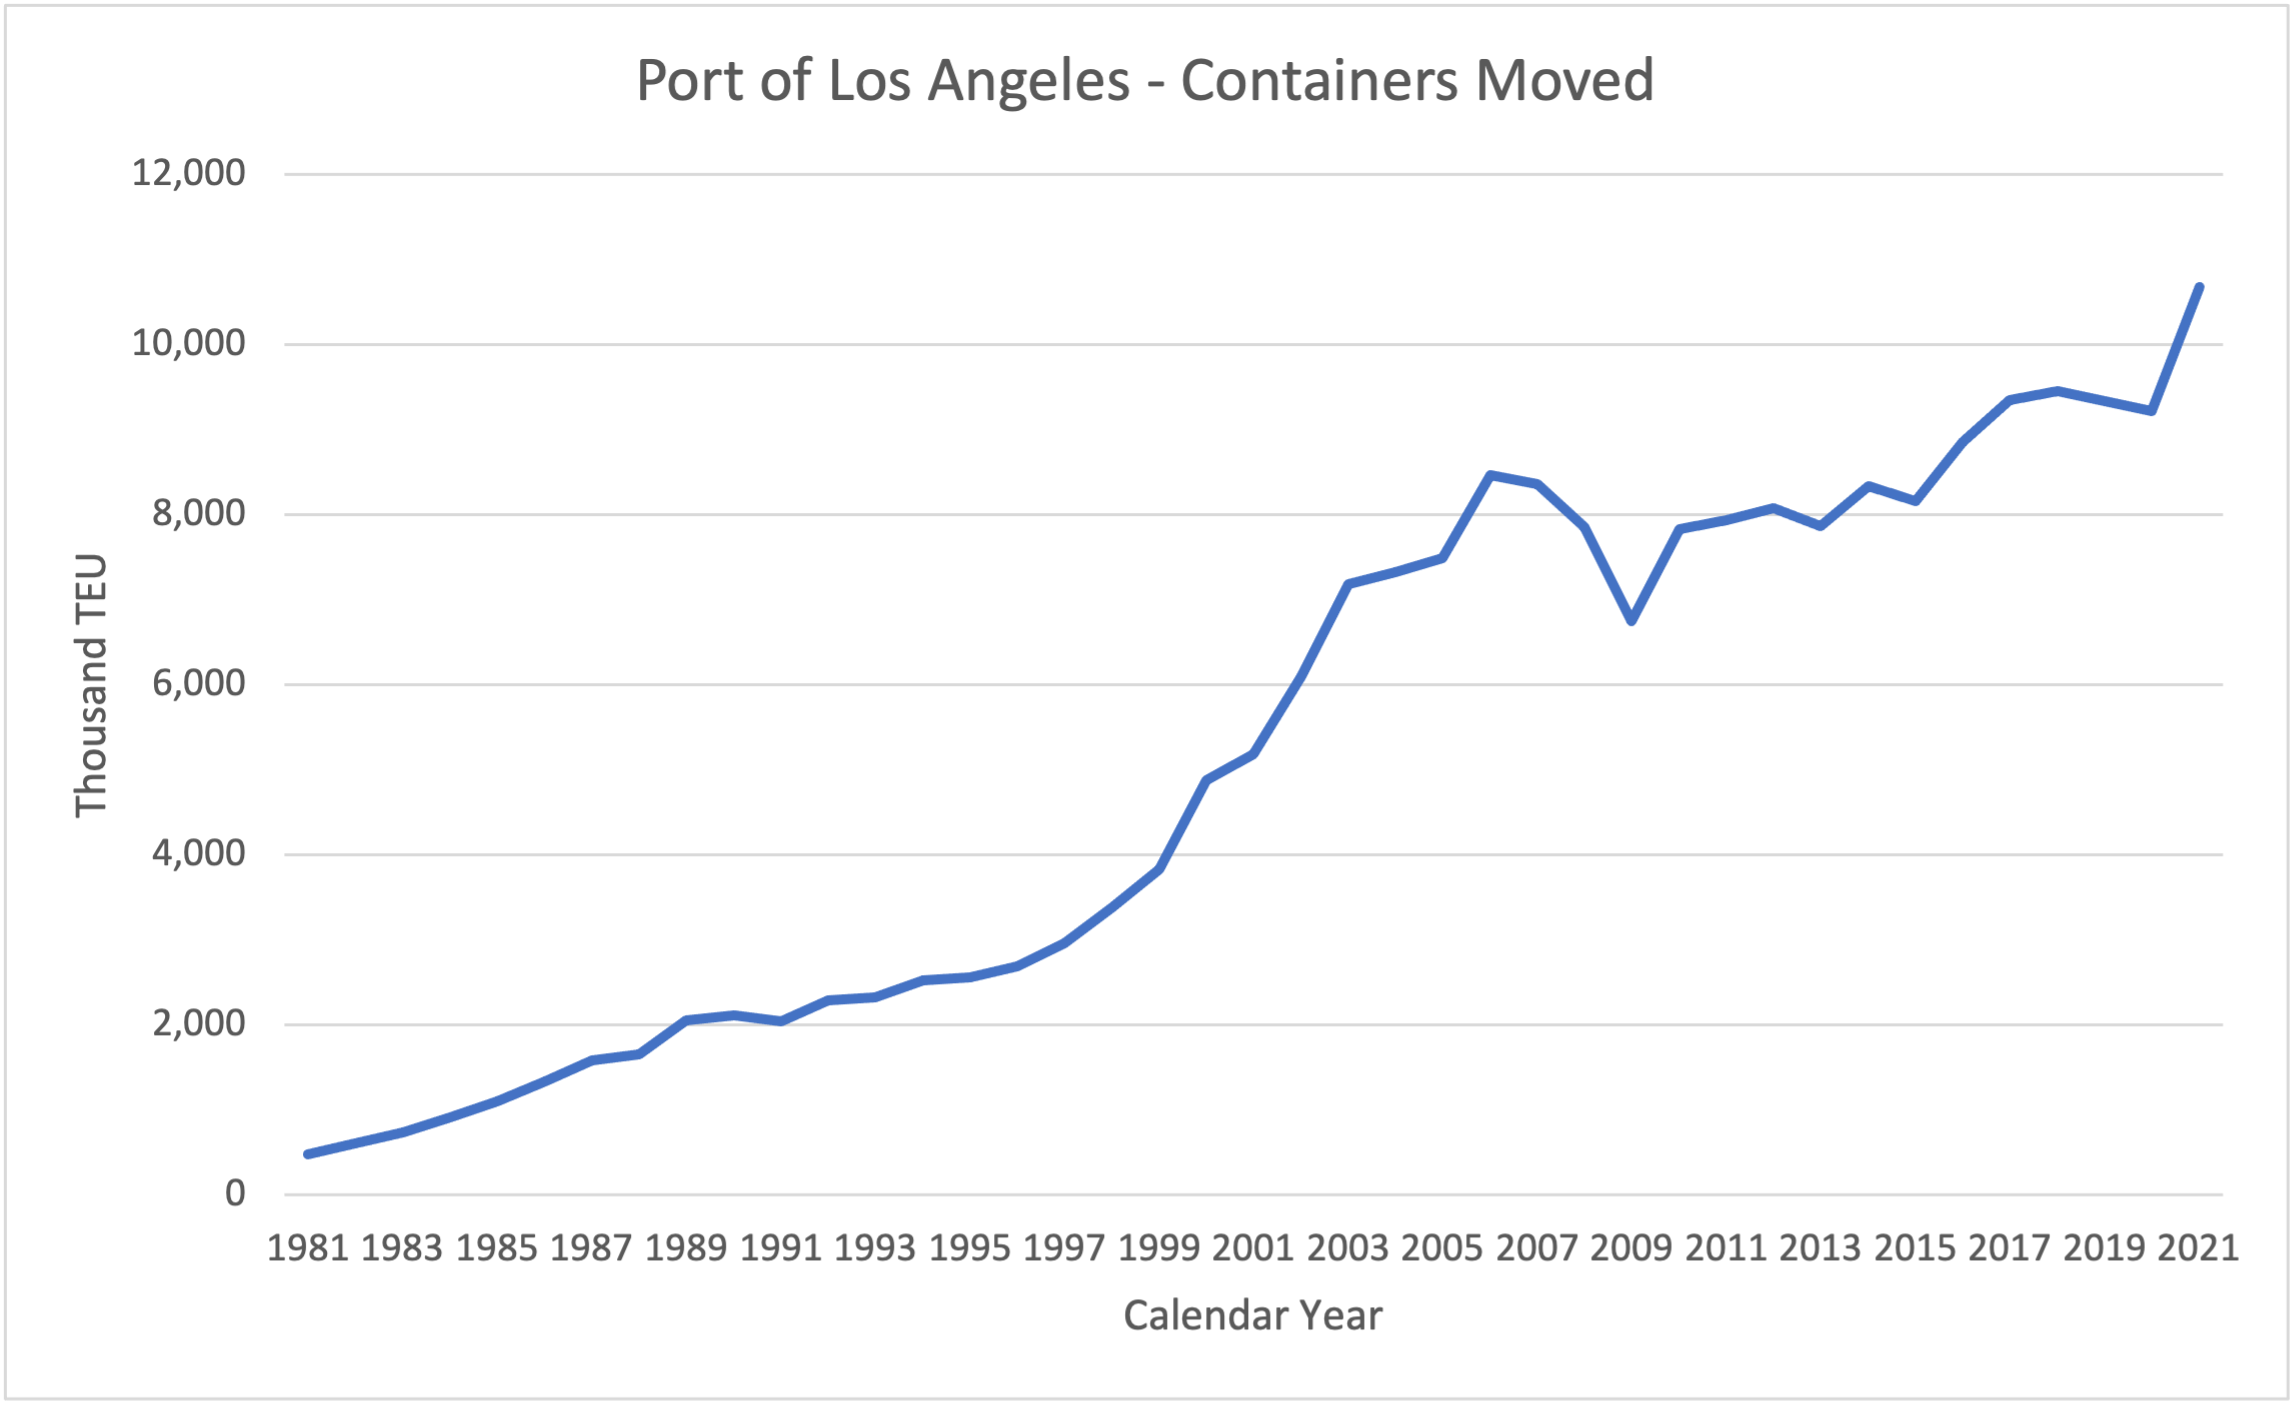
New data from the Port of Los Angeles released this week make it clear that many “supply chain shortages” are simply the result of Americans Buying More Stuff.
The port of L.A. is the busiest container port in the U.S. In calendar 2021, a total of 10.7 million twenty-foot container equivalents (TEU) moved in or out of the port, a 16 percent increase over calendar 2020. Moreover, the drop in 2020 from 2019 (COVID, recession, related economic and supply chain drama) was only 1.7 percent. The growth in containers moved was the sharpest since the initial post-2000 period when China got permanent most-favored-nation trade status from Congress and was allowed entry into the World Trade Organization (which is when U.S. companies got comfortable outsourcing industrial production to China on a permanent basis).

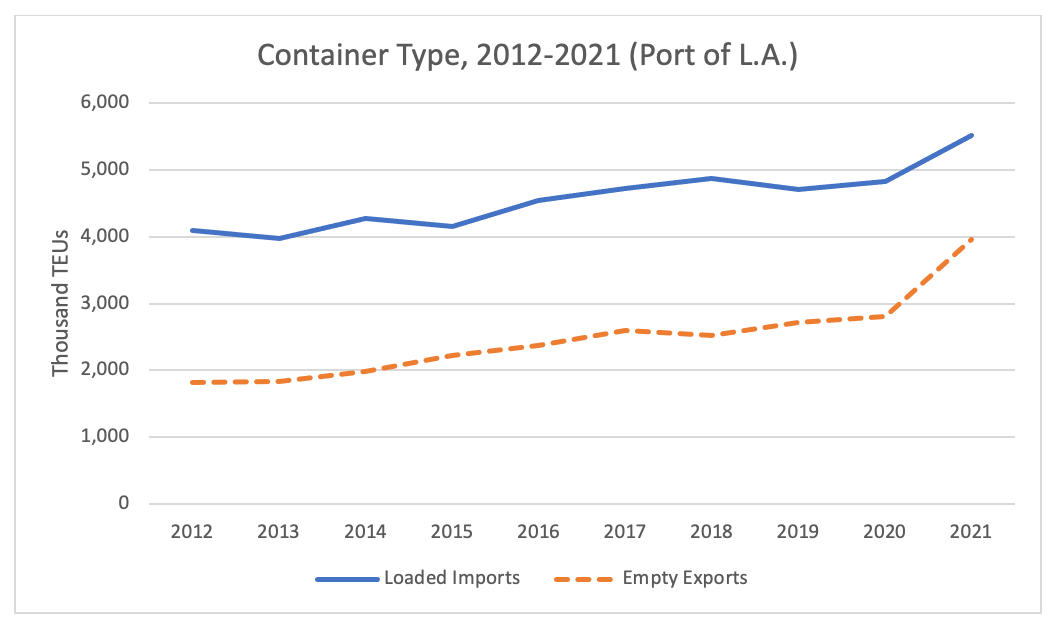
The Port of L.A.’s stats are broken down by import/export and loaded/empty for more recent years. The number of loaded containers imported from overseas (mostly China) in 2021 reached 5.5 million, a 17 percent increase over 2020’s $4.8 million. Moreover, the number of empty containers shipped overseas from the U.S. went up by 46 percent in 2021, from 2.8 million TEUs to almost 4 million TEUs.

| Port of Los Angeles Container Activity (Thousand TEU) |
|
Loaded |
Empty |
Loaded |
Empty |
| CY |
Imports |
Imports |
Exports |
Exports |
| 2012 |
4,093 |
117 |
2,043 |
1,825 |
| 2013 |
3,977 |
134 |
1,921 |
1,837 |
| 2014 |
4,270 |
160 |
1,932 |
1,978 |
| 2015 |
4,159 |
120 |
1,657 |
2,224 |
| 2016 |
4,545 |
126 |
1,819 |
2,368 |
| 2017 |
4,716 |
135 |
1,900 |
2,592 |
| 2018 |
4,871 |
165 |
1,904 |
2,519 |
| 2019 |
4,714 |
150 |
1,756 |
2,718 |
| 2020 |
4,827 |
49 |
1,531 |
2,806 |
| 2021 |
5,513 |
27 |
1,184 |
3,953 |


