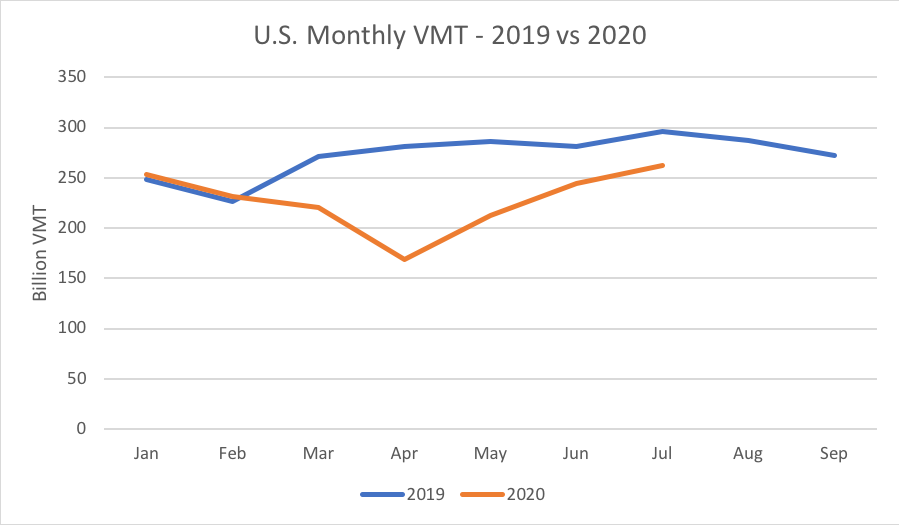
The July issue of Traffic Volume Trends from the Federal Highway Administration says that total vehicle miles-traveled (VMT) on U.S. roadways in July 2020 was down 11.2 percent from the July 2019 level (262.4 billion VMT versus 295.6 billion VMT).
This marks a continued rebound from COVID-related travel reduction, but the rate of rebound has slowed:
| U.S. Monthly VMT in 2020, Below 2019 Levels, Percentage |
| March |
April |
May |
June |
July |
| -18.9% |
-40.1% |
-25.6% |
-13.2% |
-11.2% |
Graphically, it looks like this:

There is reason to believe that the rebound in VMT won’t continue until something changes with the novel coronavirus. While getting the VMT estimates from FHWA takes almost two months, the Energy Department reports gasoline production by refiners and blenders on a weekly basis (on Wednesday mornings, for the week ending the previous Friday).
Gasoline use is not a perfect proxy for VMT, and gasoline production is an even more imprecise proxy, because producers try to anticipate demand at the pump by a couple of weeks, to give the product time to get to service stations. And there is some storage capacity for finished gasoline in the system, to make up for weeks where production slows due to hurricanes or other refinery problems.
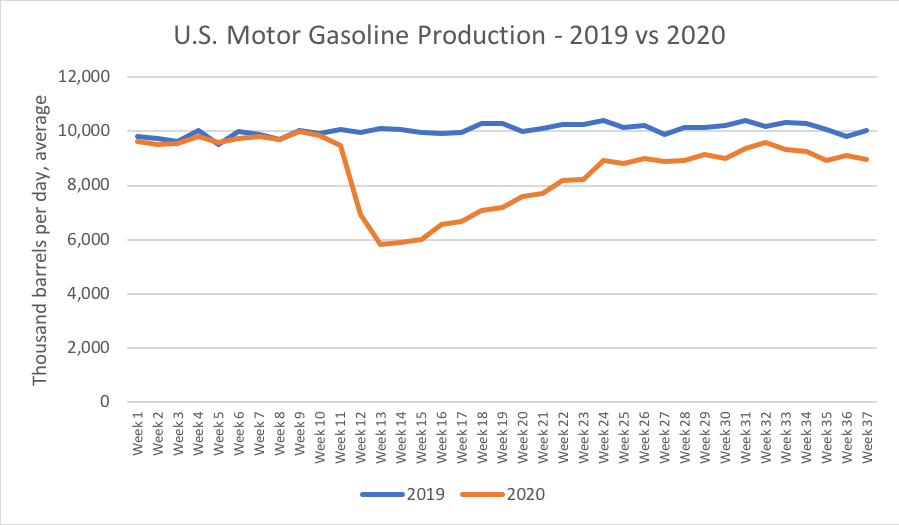
But the coronavirus experience has shown that gasoline production is a pretty good two-week-preceding-indicator of VMT. The following chart shows weekly production of finished motor gasoline for each full week of 2019 and 2020. (“Week 1” in the table refers to the week ending January 11, 2019, and the week ending January 10, 2020, and just keep adding 7 days to that, plus the 2020 Leap Day.) Data is through last Friday (September 18).

Gas production plummeted in the second half of March, bottoming out at 42.5 percent below 2019 levels the week ending April 3. It crept back up steadily, hitting the -30 percent mark the week ending May 15, and the -20 percent mark the week ending June 5. Since then, however, gasoline production has stabilized in a narrow band that averages 10.6 percent below 2019 production levels, since the week ending June 19:
| U.S. Weekly Gasoline Production in 2020 Has Been This Much Below the Corresponding Week in 2019: |
| Week Ending: |
| June 12 |
June 19 |
June 26 |
July 3 |
July 10 |
July 17 |
July 24 |
July 31 |
| -19.7% |
-14.1% |
-13.2% |
-11.8% |
-10.0% |
-12.1% |
-9.9% |
-12.1% |
|
|
|
|
|
|
|
|
| Aug. 7 |
Aug. 14 |
Aug. 21 |
Aug. 28 |
Sept. 04 |
Sept. 11 |
Sept. 18 |
|
| -10.1% |
-6.1% |
-9.7% |
-10.0% |
-11.2% |
-7.2% |
-10.6% |
|
If gasoline production as a preceding indicator of VMT holds up, then aggregate VMT may also stabilize in the 10-12 percent below 2019 level for several more months.
The new FHWA report also indicated that the rural-urban divide in type of road traffic continues. July traffic on urban Interstates was down 14.8 percent from 2019; rural Interstates down 12.7 percent. On non-Interstate arterial roads, the urban drop was 11.8 percent from 2019, as opposed to 8.6 percent on rural arterials. And on non-arterial roads, urban traffic was down 10.7 percent from last year while rural traffic was only down 6.6 percent.
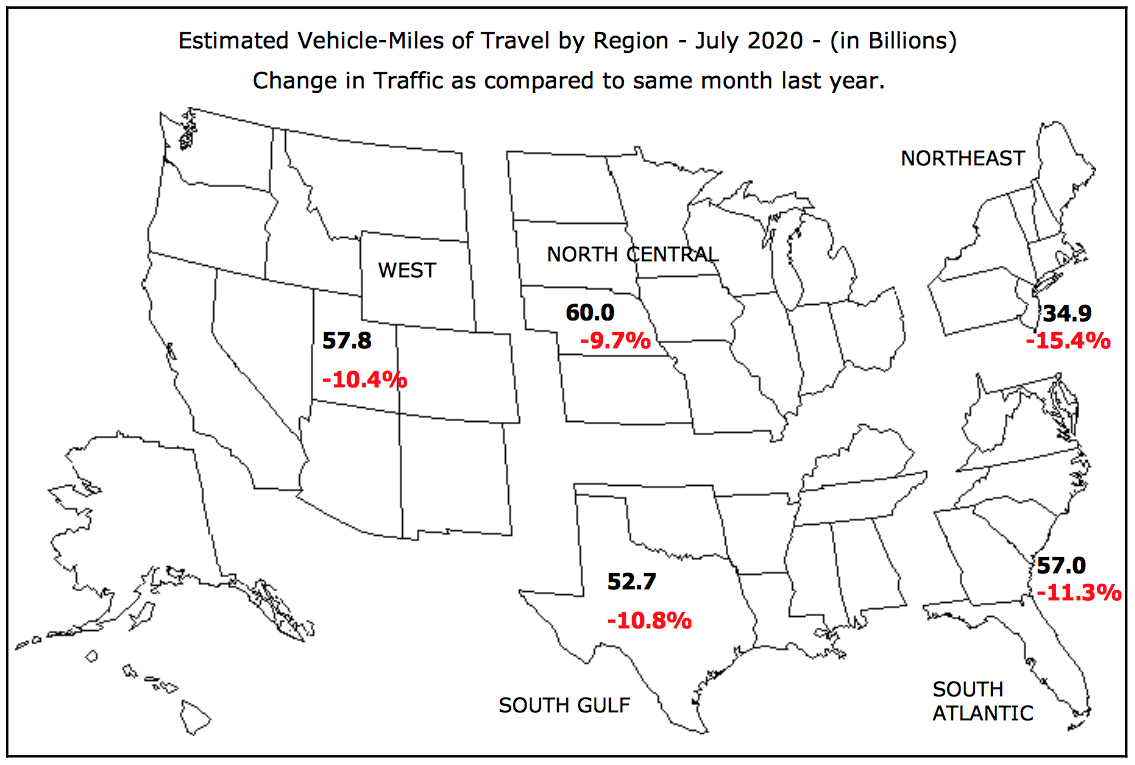
And some regional differences in the VMT drop persist as well, per this map from the cover of the new report:


