VMT Back to Pre-COVID Level in 2023, but Still Lags Per Capita
The Federal Highway Administration released the year-end 2023 edition of Traffic Volume Trends this week, showing that the estimated total vehicle-miles driven in the U.S. last year finally exceeded the pre-COVID 2019 level. The nationwide estimate is for 3,263.7 billion VMT on the year, an increase of 67.5 billion over the prior year (+2.1 percent).
| Year | Million VMT |
| 2019 | 3,261,772 |
| 2020 | 2,903,622 |
| 2021 | 3,140,088 |
| 2022 | 3,196,192 |
| 2023 | 3,263,739 |
On a per capita basis, this worked out to an extra 202 miles per U.S. resident in 2023 vs 2022, or about 973 yards per day.
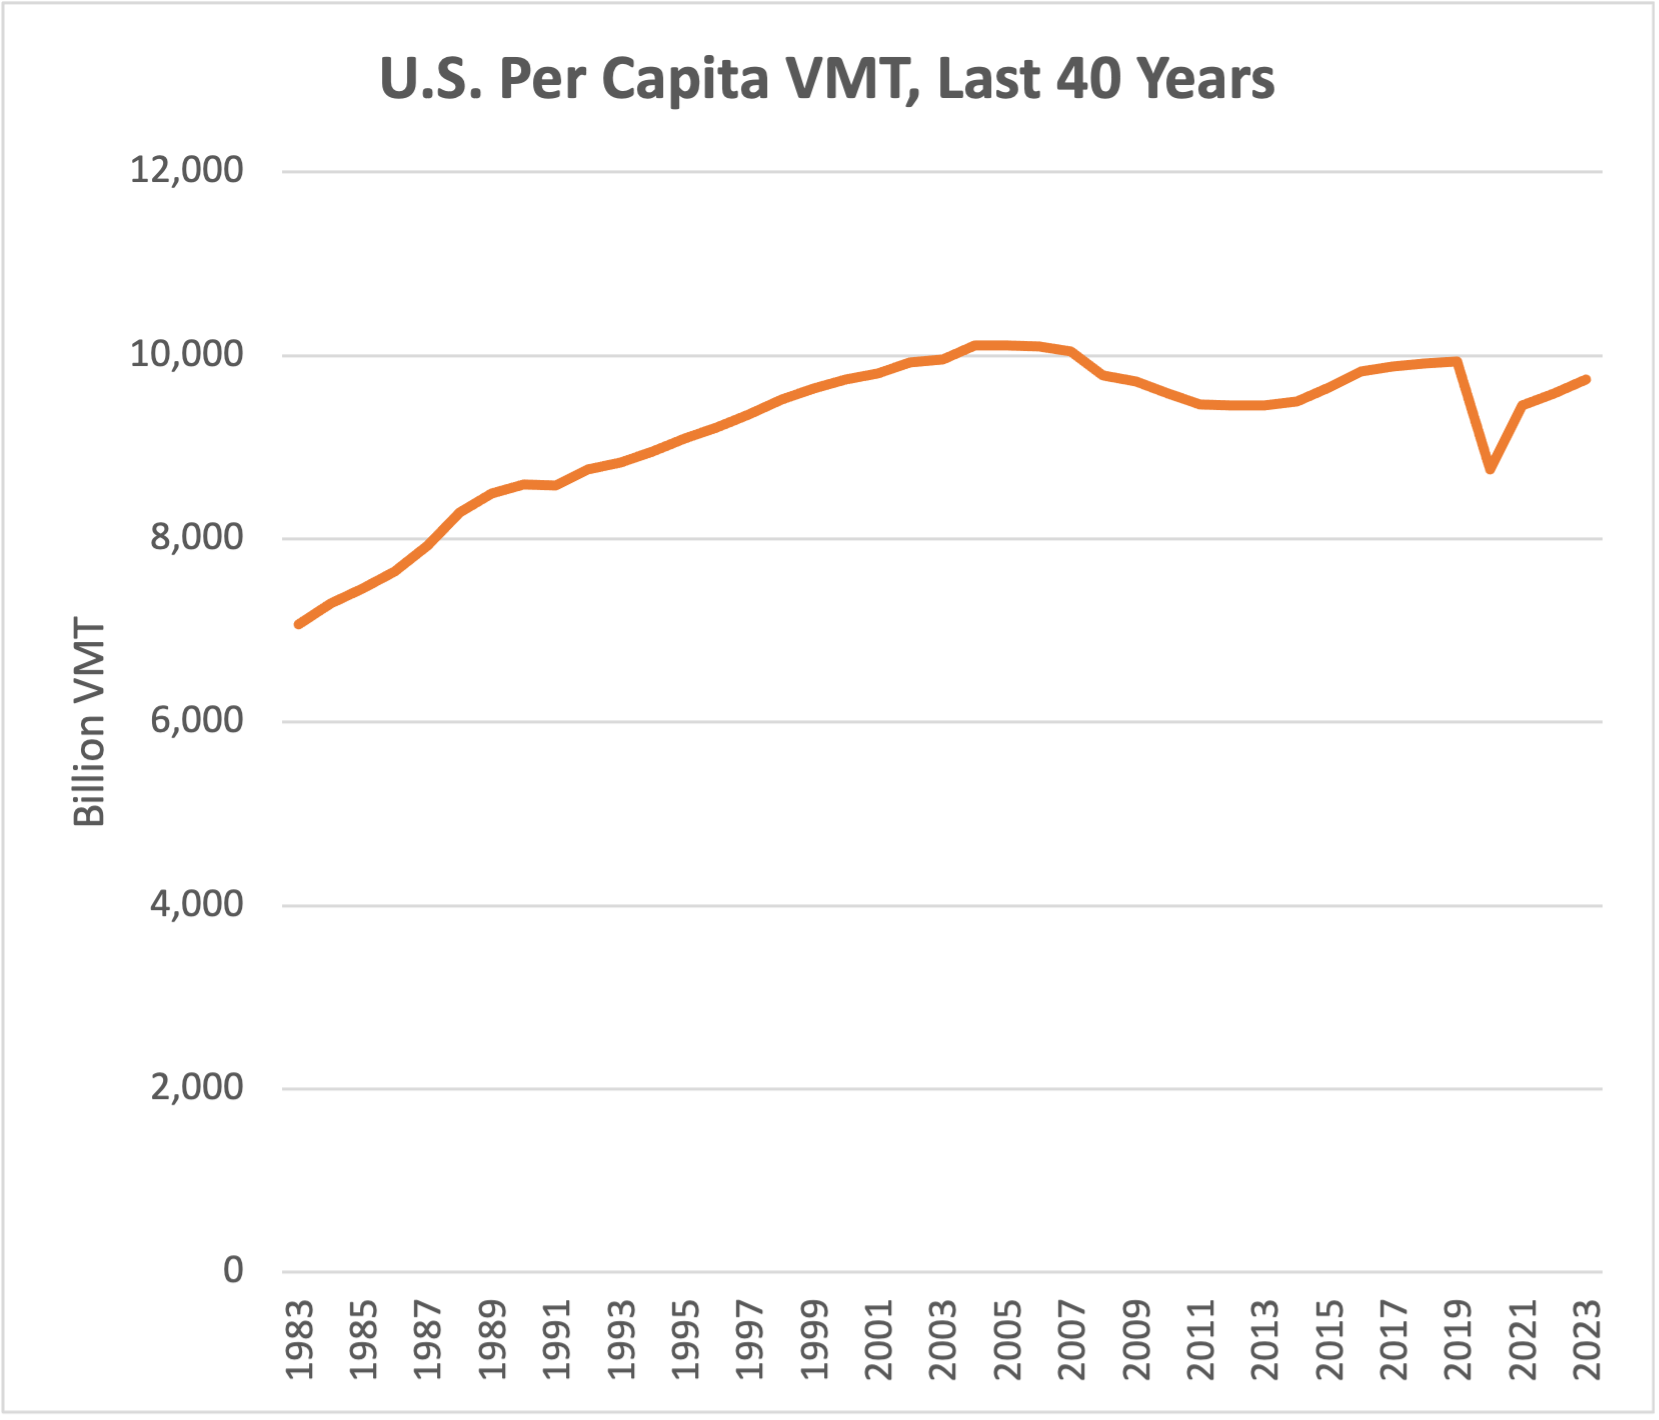
But on that per capita basis, total VMT in 2023 was still 1.9 percent below 2019 and 3.7 percent below the all-time peak set in 2004. Per capita, using the Census Bureau’s July 1 resident population estimates for each year, each resident’s share of total U.S. VMT in 2023 was 9,745 VMT, versus 9,934 VMT in 2019 and 10,117 VMT back in 2004.
Over the last 40 years, per capita VMT rose rapidly in the 1980s and then more slowly in the 1990s and early 2000s before peaking in 2004, around the time that gasoline prices were in the process of almost tripling from 2003-2005. The decline in per capita VMT accelerated during the financial crisis, then began increasing again in 2013 until COVID happened.
Going back to absolute, rather than per capita, VMT – interestingly, in 2023, the rate of increase of VMT was roughly the same in both urban and rural areas:
| Rural | Urban | Total | |
| 2022 | 1,025,711 | 2,170,481 | 3,196,192 |
| 2023 | 1,048,103 | 2,215,636 | 3,263,739 |
| Increase | +22,392 | +45,155 | +67,547 |
| +2.2% | +2.1% | +2.1% |
Contrast this to the pre-COVID year of 2019, and rural VMT has grown by 5.9 percent since 2019 while urban VMT is still 2.8 percent below 2019.
| Rural | Urban | Total | |
| 2019 | 989,900 | 2,279,188 | 3,269,088 |
| 2023 | 1,048,103 | 2,215,636 | 3,263,739 |
| Increase | +58,203 | -63,552 | -5,349 |
| +5.9% | -2.8% | -0.2% |
(Caveat: the urban-rural divide is difficult to deal with in situations like this, because Census only updates its geographic boundaries of urban areas (leaving the rest rural) every 10 years, after the new decennial Census. So 2019 VMT data was using the geographic boundaries of urban areas as they existed in the 2010 Census and were defined a year or two later, and the 2023 data is using the new 2020 Census urban boundaries. The farther you get away from a decennial redefinition of urban boundaries, the less reliable the data becomes, because a lot of people can move to a location in a decade and push it over the density line from rural to urban.)

