Eno conducted an analysis of the international market for air travel in November 2018 for the Japan International Transport Institute. This multi-part ETW series (part 1, part 2 & part 4) details some of the most interesting facts and findings of that work. Although the research does not predict the future or propose any recommendations, the results are instructive for thinking about how international air service has evolved over the past few decades.
The data analyses use three data sources: (1) publicly available data from the U.S. Department of Transportation (T-100 dataset), (2) Sabre Corporation’s Market Intelligence Data and Analytics, and (3) existing reports and other publicly available information. The data from Sabre is not publicly available, but the Eno Center for Transportation was able to gain access through a subscription paid for by the Japan International Transport Institute, USA. Sabre uses public and private data to create a suite of data resources which analyzes traffic trends and fills in gaps missing in the T-100 dataset. The data available during the creation of this report includes a “final” dataset from 2010-2017, where Sabre’s algorithms verify the accuracy and update data points as necessary. The data set also includes “preliminary” MIDT (Marketing Information Data) data from 2002-2009. While this data is not as precise as the final dataset, it can provide enough information for broad trends.
As recently as 2005, Japan was the non-stop destination of over 70 percent of all U.S. international traffic in Asia. In large part due to the opening of the polar routes, Japan’s share of international traffic declined to 42 percent by 2016.[1] New airplanes, new routing, and robust Asian economies have dramatically altered the role of Japan as the gateway to Asia.
Since the advent of aviation, technology has enabled single flights to cover farther and farther distances. This makes flying more convenient for travelers and airline companies alike, as layovers and stops costs both time and money. Table 1 shows the current distance range of ultra-long-distance flights.
Table 1: Longest Commercial Flights by Distance, 2017-2018
Route
|
Airline
|
Distance (km)
|
| Singapore-New York (Service set to begin late 2018)[2] |
Singapore Airlines |
15,345 |
| Doha-Auckland[3] |
Qatar Airways |
14,536 |
| London-Perth |
Qantas Airways |
14,500 |
| Dubai-Auckland |
Emirates |
14,201 |
| Singapore-Los Angeles |
United Airlines |
14,114 |
| Sydney-Houston |
United Airlines |
13,993 |
| Sydney-Dallas |
Qantas Airways |
13,805 |
| Singapore-San Francisco |
United/Singapore |
13,593 |
| Atlanta-Johannesburg |
Delta Air Lines |
13,581 |
| Abu Dhabi-Los Angeles |
Etihad Airways |
13,502 |
Source: The Economist, “The rise of the ultra-long-haul flight,” March 27, 2018; Ben Mutzabaugh, “The world’s 25 longest airline flights,” USATODAY, June 1, 2018
Today, commercial jet manufacturers: Boeing and Airbus, produce aircraft capable of flying ultra-long-haul distances over 15 hours. New carbon fiber composite bodies, super-efficient engines, folding wingtips, and aerodynamic design allow marathon trips and maximize fuel management. In March 2018, Australian carrier Qantas completed a 17-hour, 14,500-km (9,010-nautical mile) flight from Perth, Australia to London aboard a Boeing 787-9.[4] Qantas’ more ambitious ultra-long-haul goal is the aspirational 20-hour, 16,997 km flight between London to Sydney (9,177 nmi), which they hope to launch in 2022.[5]
U.S. carrier, United, now flies from Houston to Sydney and Los Angeles to Singapore.[6] Singapore Airlines also offers niche, ultra-long-haul flights with their upcoming Singapore to New York trip (17,594 km; 9,500 nautical miles).[7]
The earth’s circumference is 40,075 km or 24,901 miles, meaning any aircraft that can fly half that distance can reach any point on the planet without stopping. However, there might not be a market for any aircraft that can fly further than 10,000 miles. Few major cities are further than 10,000 miles apart, and those that are do not have enough demand for non-stop service at that distance.
The Airbus A350-900ULR, included in the Table 2 compilation of anticipated ultra-long-range commercial aircraft, is set to be the longest-range commercial jet upon its release. A350 XWB (extra wide body), the newest ultra-long-range commercial aircraft from Airbus, flew its first test flight April 2018.[8] It improves upon the A350-900 model and will reach distances of 9,700 nautical miles (17,965 km).[9] Airbus is set to launch A350-900ULR (ultra-long range) during August 2018, which is billed to fly 20 hours nonstop.[10] Boeing offers two aircraft families to serve this growing niche market: the B787 and B777X. Boeing’s plans for the 777X might match or beat the A350-900ULR in its flying range, but the 777X is still under development.[11]
Table 2: Anticipated Ultra Long-Range Commercial Aircraft
Manufacturer
|
Aircraft
|
Range (km)
|
Range (nmi)
|
Year of Release
|
| Boeing |
787-9 |
14,140 |
7,635 |
2014 |
| 777-8 |
16,110 |
8,700 |
2022[12] |
| 777-9 |
14,075 |
7,600 |
2020[13] |
| Airbus |
350-900ULR |
17,965 |
9,700 |
2018[14] |
| A380 |
15,200 |
8,208 |
2007 |
Source: Boeing, Airbus
Russia and Polar Routing
The most efficient route for U.S.-Asian traffic is not across the Pacific Ocean, as most standard-projection maps might suggest. Instead, the shortest route is across the Arctic. But 20th century geopolitics closed the arctic shortcut route for most carriers, which forced travelers to connect in Japan or Europe if they wanted to get to Australia, India, or other Asian markets. As Figure 1 shows, conflict with the Soviet Union meant that no commercial airliner coming to or from the U.S. could traverse Soviet airspace. Other countries, such as Mongolia and China, were also off-limits for U.S.-bound passenger traffic.
Figure 1: Flight Restrictions Over the Arctic
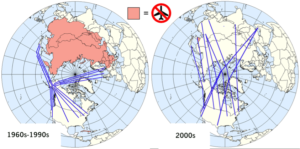
The fall of the Soviet Union in 1991 dramatically altered the landscape of international air traffic. In the late 1990s, as air traffic control services in the former U.S.S.R. improved, airlines began using polar routes to connect more directly to international markets. This had direct impacts on Japan’s Tokyo Narita Airport, which for many years was the hub airport for U.S.-Asian traffic.
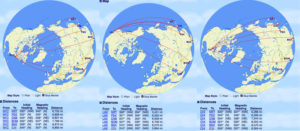
As the routes shown in Figure 2 demonstrate, stopping in Japan offers little advantage in comparison to polar routes for passengers bound for Korea or China. Routes to major destinations in Asia, including Tokyo (NRT), Beijing (PEK), Dubai (DXB), Mumbai (BOM), Bangkok (BKK), and Seoul (ICN) are easily accessible with today’s aircraft technology from any major U.S. city. While Tokyo is the closest major Asian destination for most U.S. cities, using Japan as a layover adds significant time, distance, and cost to reach other Asian cities.
Figure 2: Routes and Distances Between Major U.S. and Asian Airports
Source: Great Circle Mapper
Traffic to select Asian countries
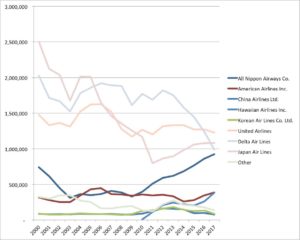
Overall, airlines have been reducing passenger numbers to and from Japan since 2000 (Figure 3). Delta, United, and Japan Air Lines in particular have shed flights and passengers, with only ANA increasing passenger volumes significantly.
Figure 3: Departing Passengers to Japan, by Airline
Source: Bureau of Transportation Statistics, T-100 International Market (All Carriers)
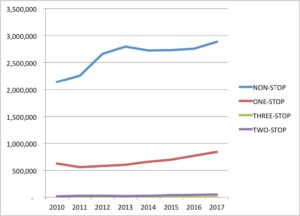
Almost 80 percent of passengers traveling to Japan have a non-stop flight from the U.S., but Figure 4 shows that transfers are growing. This is in part because of competition from foreign carriers with hubs in South Korea and Hong Kong to transfer outside of Japan.
Figure 4: Non-stop vs. Connecting Passengers From US to Japan
Source: Sabre Market Intelligence, Final Dataset, 2018
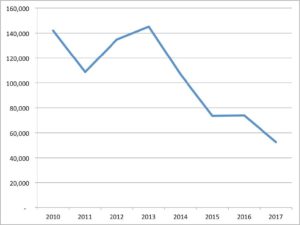
Meanwhile, Narita Airport, Tokyo’s internationally-focused hub, is becoming less of an international hub to connect the U.S. to other Asian destinations. Transfers at Narita (counting passengers originating in the U.S. only) have declined from 142,000 in 2010 to 52,000 in 2017.
Figure 5: Passengers from U.S. to China via Narita Airport
Source: Sabre Market Intelligence, Final Dataset, 2018
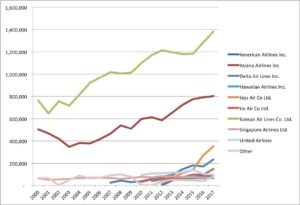
Meanwhile, South Korea has experienced an increase in non-stop passenger volumes, although not as dramatic as in China. Figure 6 shows that Asiana and Korean Air Lines are increasing passenger levels, and U.S. carriers have few non-stop flights to the country. Delta has announced that it will make the new Terminal 2 its primary Asian hub, reducing its emphasis on Narita and increasing flights to and from Incheon.[15]
Figure 6: Departing Passengers to Korea, by Airline
Source: Bureau of Transportation Statistics, T-100 International Market (All Carriers)
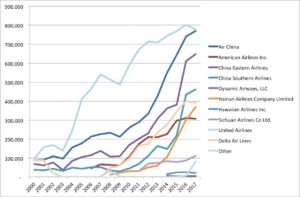
China has seen dramatic growth from nearly all airlines serving it. Figure 7 shows United is still the top carrier for international travel between the U.S. and China, but major Chinese airlines have greatly increased their flights, and therefore passengers, to and from the U.S. Air China, China Eastern, and China Southern are now the three next largest airlines serving that market, and will likely surpass United in 2018.
Figure 7: Departing Passengers to China, by Airline
Source: Bureau of Transportation Statistics, T-100 International Market (All Carriers)
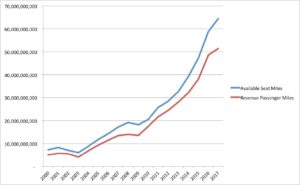
Figure 7 shows the three US carriers all declining in passengers in 2017. While it is difficult to tell if this is a long-term trend, Figure 8 shows that the market has expanded in capacity (available seat miles, ASM) faster than passengers (revenue passenger miles). ASM has been growing faster than RPM, indicating that there is too much service in the market coming from rapid increase of passengers on Chinese carriers. In 2017, Chinese carriers continued to increase capacity and American carriers cut back flights, perhaps in response to the additional capacity.
Figure 8: Revenue Passenger Miles and Available Seat Miles, US-China
Source: Bureau of Transportation Statistics, T-100 International Market (All Carriers)
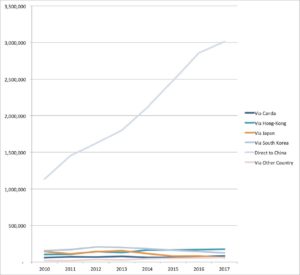
China is not creating major international hub airports for U.S. traffic. Instead, all the growth in traffic has come from non-stop flights, shown in Figure 9.
Figure 9: Passengers from U.S. to China
Source: Sabre Market Intelligence, Final Dataset, 2018
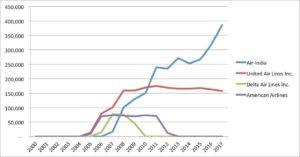
The market for direct flights to and from India is much more difficult for airlines to serve. Direct flights between New York and Delhi are more than 14 hours in length. Figure 10 shows that Delta and American have served the Indian market over time, but United is the only airline with continued service. Delta has announced that it will resume flights to India in 2019. To date, only Air India has grown passengers.
Figure 10: Total Non-stop Passengers US-India, by Airline
Source: Bureau of Transportation Statistics, T-100 International Market (All Carriers)
Most passengers flying to India from the U.S. make a connection. Only 19 percent of all departing passengers fly direct, while 75 percent make one stop and the remaining 6 percent make two stops before arriving in India.[16] Flights through Dubai, Qatar, and Abu Dhabi are the most popular way to get between the U.S. and India. The only major connection point for US-India traffic in the Asia market is Hong Kong.
[Continued in the fourth installment, which discusses future projected air travel. Parts 1, 2 and 4 of this series can be accessed here, here, and here ]
[1] Air Carrier Statistics (Form 41 T-100), “International Segment, 2005-2016” Bureau of Transportation Statistics, 2018.
[2]The Economist, “The rise of the ultra-long-haul flight,” March 27, 2018.
[3] Ben Mutzabaugh, “The world’s 25 longest airline flights,” USATODAY, June 1, 2018.
[4] The Economist, “The rise of the ultra-long-haul flight,” March 27, 2018.
[5] Jamie Freed, “Airbus, Boeing close in on Qantas’ ultra-long haul dream,” Reuters, April 5, 2017.
[6] Rosie Spinks, “The World’s Longest Flights are Making a Comeback,” Quartzy, January 1, 2018.
[7] Michael Goldstein, “A Day on the Plane: Airbus A350 Ultra-Long-Range Readies for 20-Hour Flights,” Forbes, April 27, 2018.
[8] Airbus, “Ultra Long Range A350 XWB completes first flight,” Press Release, April 23, 2018.
[9] David Kaminski-Morrow, “PICTURE: First A350-900ULR starts flight-test campaign,” FlightGlobal, April 23, 2018.
[10] Wallace Cotton, “Airbus A350-900 ULR, the Longest-Range Aircraft, Makes First Flight,” The Points Guy, April 23, 2018.
[11] Dominic Gates, “Boeing’s Machinists and robots start building first 777X, but challenges remain,” Seattle Times, October 23, 2017.
[12] Stephen Trimble, “Boeing starts fuselage assembly for first 777-9,” FlightGlobal, March 23, 2018.
[13] Stephen Trimble, “Boeing starts fuselage assembly for first 777-9,” FlightGlobal, March 23, 2018.
[14] Wallace Cotton, “Airbus A350-900 ULR, the Longest-Range Aircraft, Makes First Flight,” The Points Guy, April 23, 2018.
[15] Bart Jansen, “Delta CEO looks to Asia, Europe for revenue growth,“ USA Today, June 27, 2018.
[16] Sabre Market Intelligence, Final Dataset, 2018


