July 26, 2018
Given their popular presence in urban areas, state and local policymakers are increasingly considering how transportation network companies (TNCs) fit into the larger transportation portfolio and can help meet mobility needs. But, too often TNC fees and taxes are narrowly focused on raising revenue, rather than advancing deliberate, long-term transportation goals. As these new mobility services proliferate, it is important to understand what purpose these fees intend to serve and how they fit into broader metropolitan transportation policies: from funding transit and infrastructure, establishing parity with taxis, covering regulatory costs, to supporting programs that improve equitable mobility.
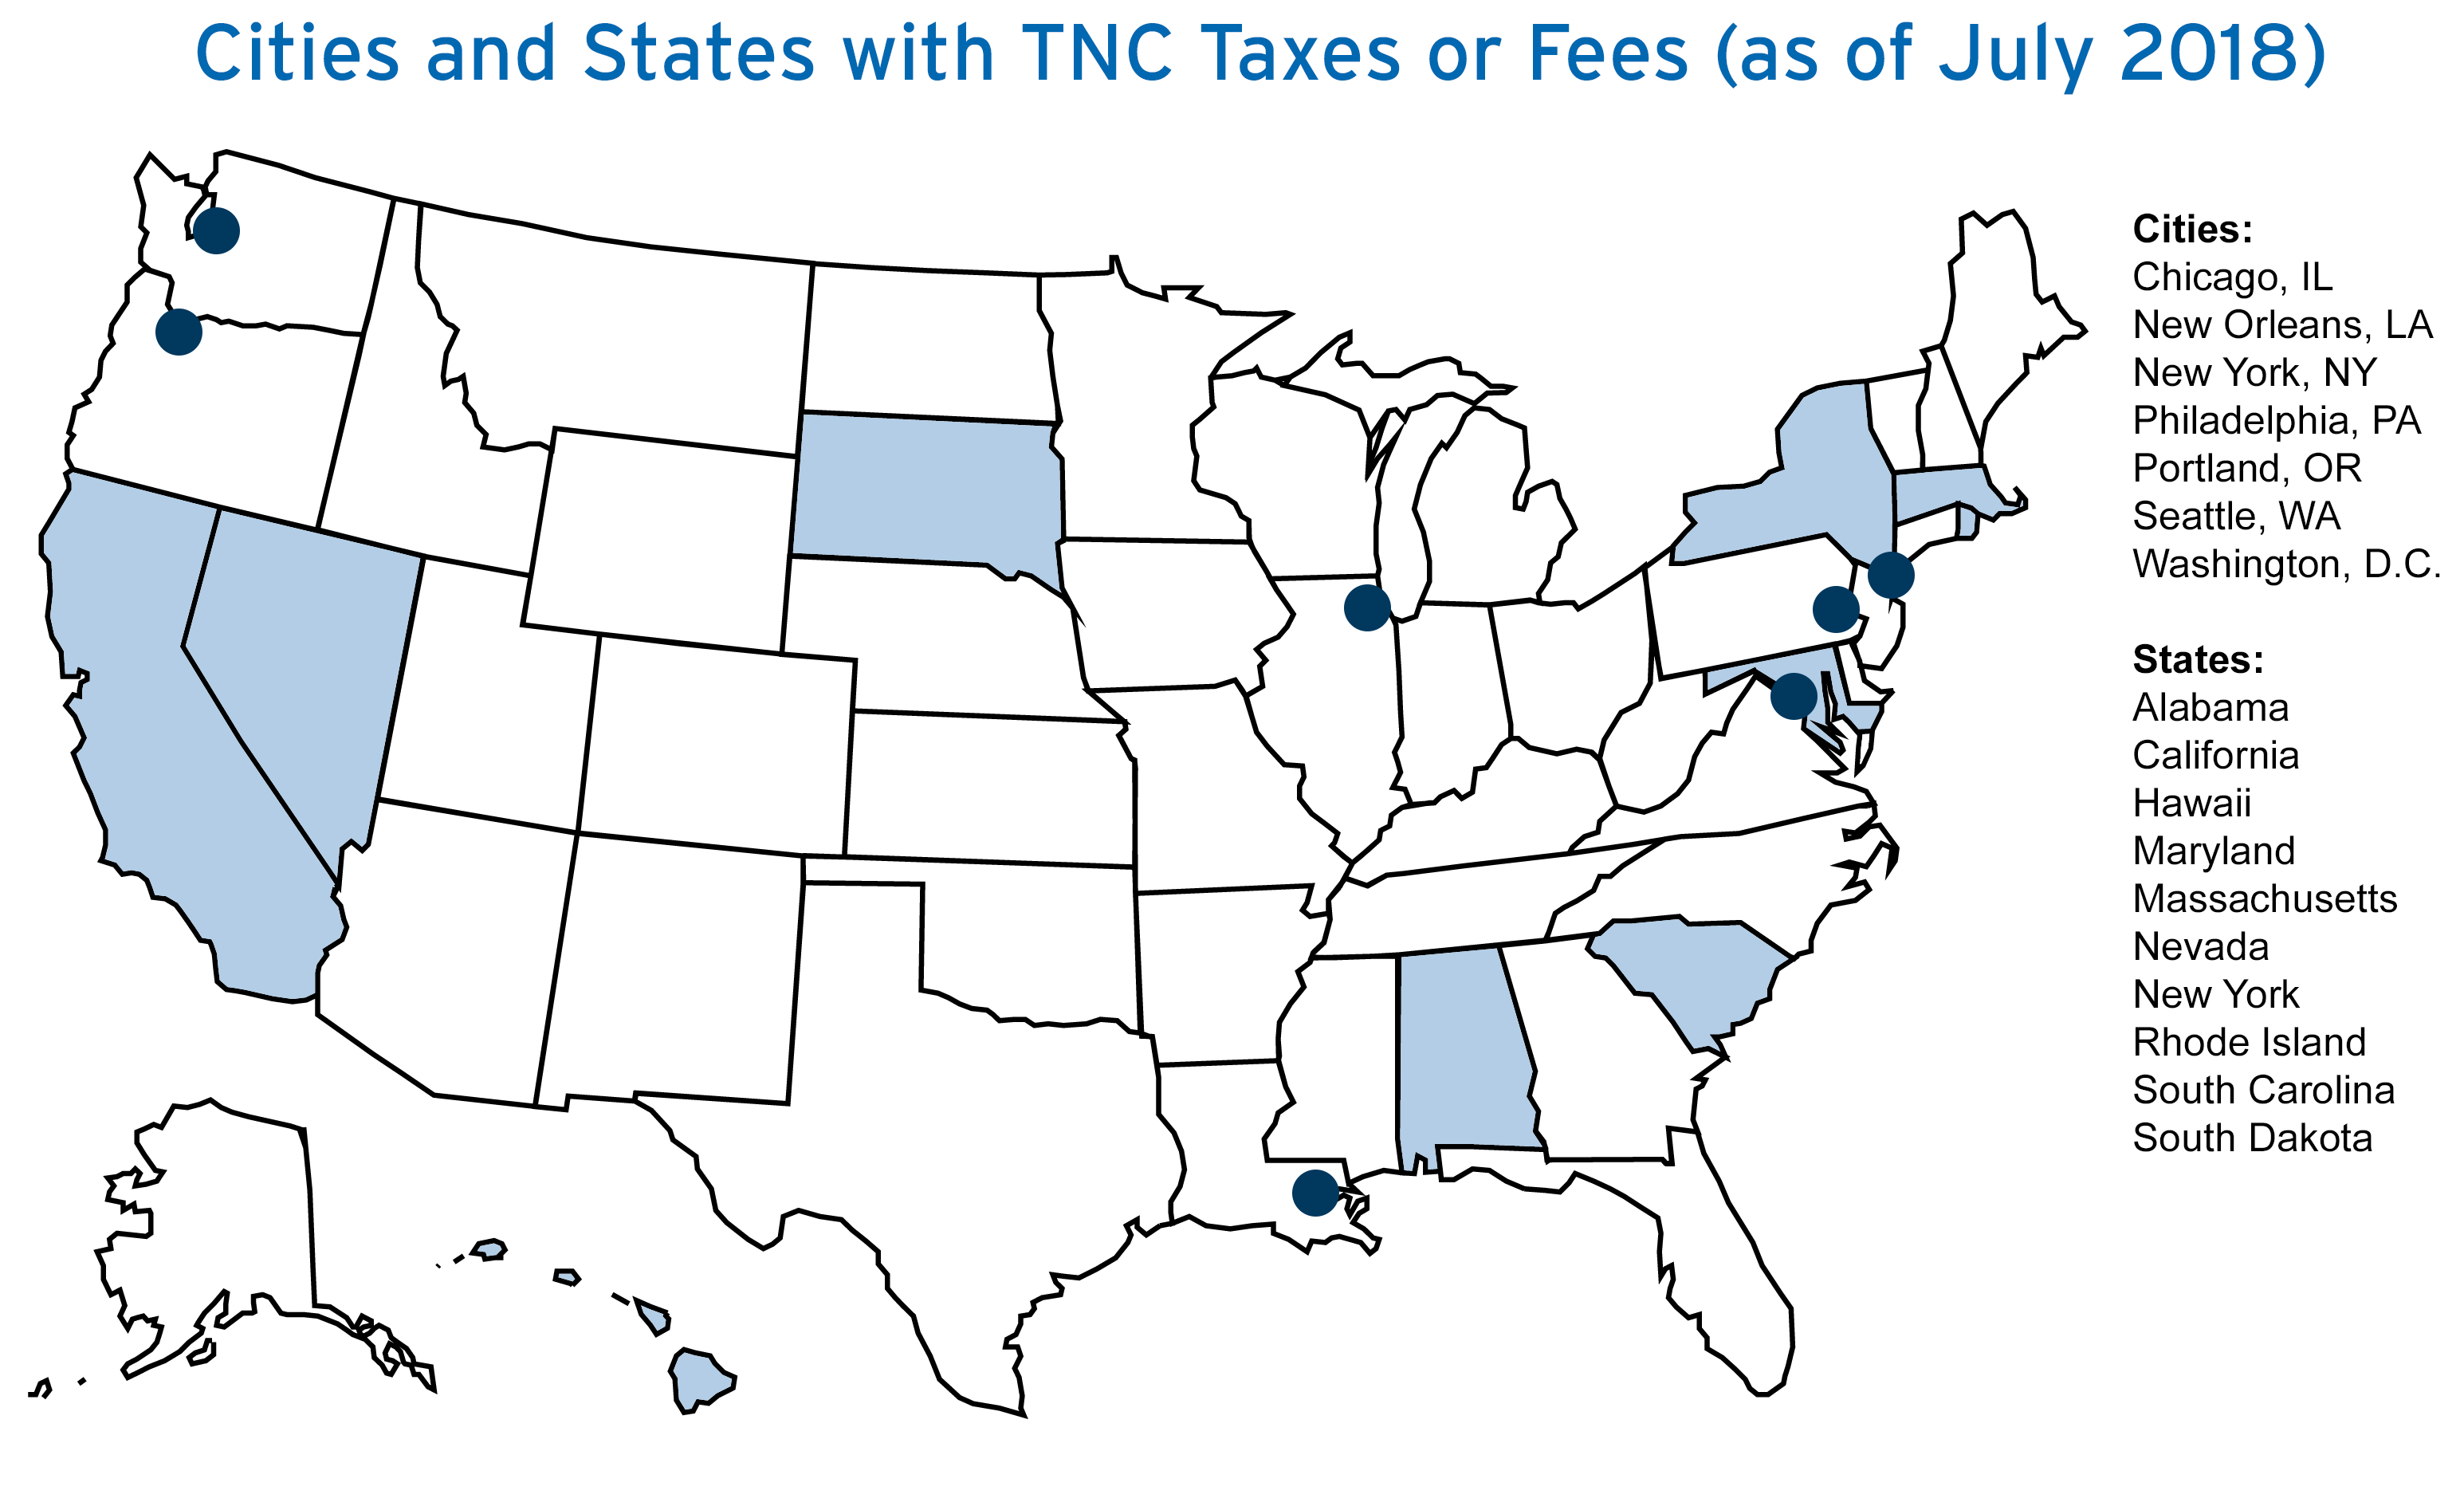
Seven major cities and 10 states currently have some type of fee or tax on TNC trips, and more are under consideration. Georgia lawmakers proposed a TNC-trip fee as part of a regional transit bill. Philadelphia officials called for switching its per-trip percentage assessment to a $0.50 surcharge in order to generate more revenue. Earlier this year, efforts in Washington State to apply the taxi sales tax to TNCs failed.
Cities and states have the responsibility to balance the ease of quickly raising revenue with achieving comprehensive public policy goals for the future of transportation. If the goal is to generate funding for transit agencies, per-trip TNC fees are likely insufficient replacements for existing budget gaps. In Chicago and D.C. for example, projected revenues cover less than 10 percent of transit agency operating budgets.If policymakers are fixated on reducing congestion, they should focus on actions that reduce single-occupancy trips—regardless of whether it is in a personal or TNC vehicle. One promising opportunity TNCs create is the ability to systematically pool rides. If pooled services are popularized effectively, they may mitigate environmental harm (i.e. emissions) from deadheading and congestion in the wider system. New York City’s tiered for-hire vehicle surcharge scheme is a positive example of policy that encourages shared rides and recognizes its comparatively reduced costs to society.
TNC fees can be part of other transportation strategies too. Some cities are using them to pay for the administrative and regulatory costs of upholding industry safety. Funds can also serve to retrofit more wheelchair-accessible taxis on the road, improve access to transit stations, and support greater equity of mobility. In all cases, TNC fees are much more effective if they are considered in the broader context of the transportation system.
Read Eno’s full brief exploring four main questions cities and states have to answer as they continue to experiment with a range of rules and regulations in a rapidly changing mobility landscape.
The accompanying table shows the current state and general purposes of TNC taxes and fees to date in the United States. Charges today range from 20 cents to almost 9 percent per trip.

| Location |
TNC Tax/Fee |
When Enacted or Implemented |
Disposition of Funds |
| Cities |
Chicago, IL |
$0.67 per trip |
January 2018 |
$0.02 to Business Affairs and Consumer Protection
$0.10 to vehicle accessibility fund
$0.55 to city general fund |
| New Orleans, LA |
$0.50 per trip originating inside the parish |
April 2015 |
100% to Department of Safety and Permits |
| New York, NY |
8.875% of total fare |
2014 |
51% to city general fund
45% to state general fund
4% to Metropolitan Transportation Authority |
| $2.75 per trip or $0.75 per rider if pooled |
January 2019 |
100% to Metropolitan Transportation Authority |
| Philadelphia, PA |
1.4% of total fare of trips originating inside the city |
November 2016 |
By Pennsylvania state law:
66.67% to city public schools
33.33% to city parking authority |
| Portland, OR |
$0.50 per trip |
December 2015 |
100% to Bureau of Transportation |
| Seattle, WA |
$0.24 per trip on rides originating inside the city |
July 2014 |
$0.14 to Department of Finance and Administrative Services
$0.10 to Wheelchair Accessible Services Fund |
| Washington, D.C. |
6% of total fare |
October 2018 |
17% to Department of For-Hire Vehicles
83% to Washington Metropolitan Area Transit Authority |
| States |
Alabama |
1% of total fare |
February 2018 |
50% to Public Service Commission regulator
50% to trip-originating cities and counties |
| California |
0.33% of total TNC revenue |
September 2013 |
100% to California Public Utilities Commission Transportation Reimbursement Account |
| Hawaii |
4% of total fare |
January 2018 |
General fund |
| Maryland |
State law allows individual counties and municipalities to impose their own per-trip assessments up to $0.25 |
July 2015 |
100% to State Transportation Network Assessment Fund
Cities assessing maximum $0.25: Ocean City, Annapolis, Frederick, Brunswick, Baltimore
Counties assessing maximum $0.25: Montgomery, Prince George’s |
| Massachusetts |
$0.20 per trip |
August 2016 |
50% to trip-originating cities infrastructure
25% to taxi industry assistance
25% to Commonwealth Transportation Fund |
| Nevada |
3% of total fare |
May 2015 |
100% to State Highway Fund up to $5 million in a two-year period, then deposits into State General Fund |
| New York |
4% of total fare on trips originating outside NYC |
June 2017 |
100% to state general fund |
| 2.5% of total fare |
2014 |
100% to Black Car Fund workers’ compensation insurance |
| Rhode Island |
7% of total fare |
July 2016 |
General fund |
| South Carolina |
1% assessment on total fare |
June 2015 |
1% to Office of Regulatory Staff
99% to State Treasury Trust and Agency Fund |
| South Dakota |
4.5% of total fare |
October 2017 |
General fund |


