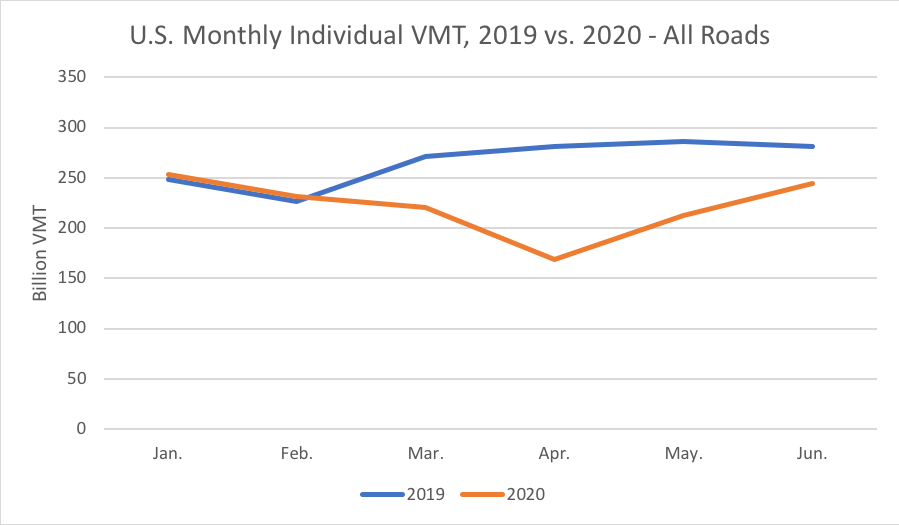
The Federal Highway Administration reported last week that traffic on U.S. roads in June 2020 was 13.0 percent below the 2019 levels. This is a significant recovery from the COVID-lockdown peak of -40.2 percent in April, which rebounded to -25.7 percent in May.

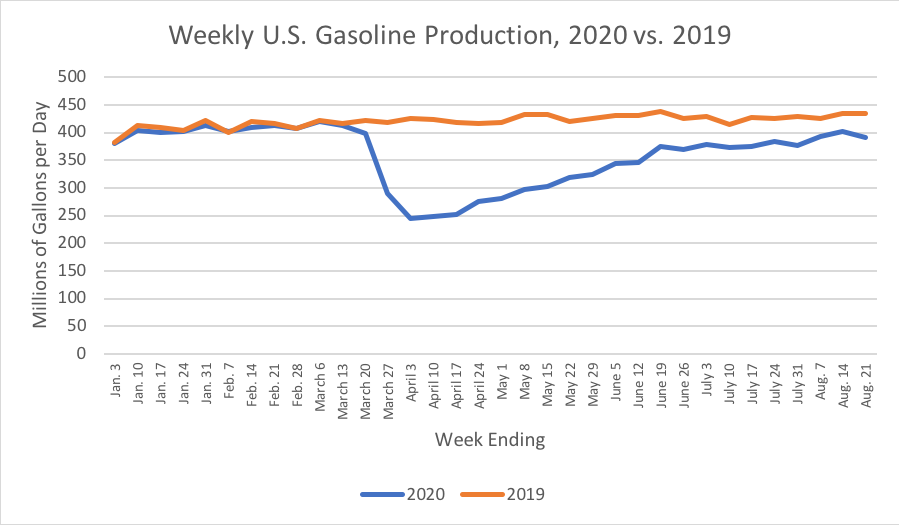
We have totals for U.S. gasoline production much more recently than VMT (the Energy Department reports on a weekly basis, and we have through last week). If the VMT pace roughly tracks the pace of gasoline production, then VMT should stabilize at around 7-10 percent below the 2019 levels for a few months.

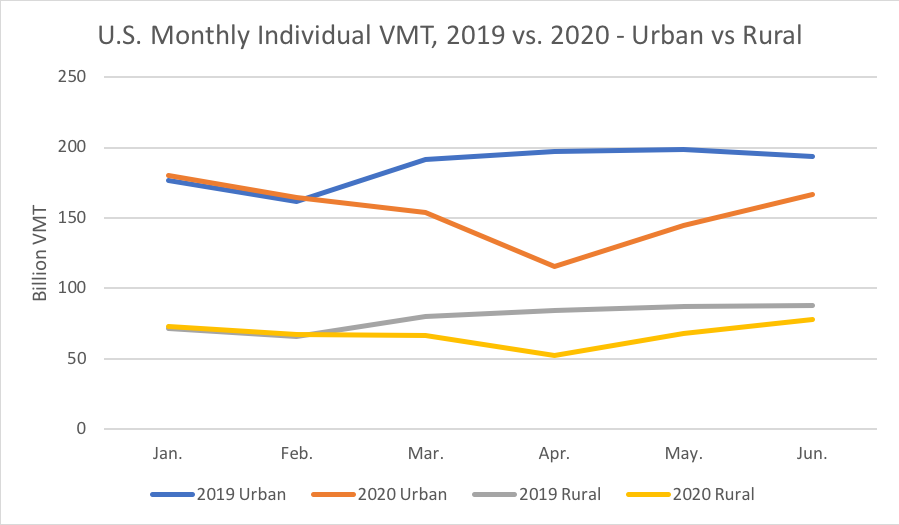
As usual, the pace of urban driving diverges from that of rural driving, with rural residents driving more and rebounding from the COVID lockdowns more quickly.
|
|
Jan |
Feb |
Mar |
Apr |
May |
Jun |
| All Urban Roads |
|
|
|
|
|
|
|
Billion VMT vs 2019 |
+3.7 |
+3.2 |
-37.7 |
-81.6 |
-54 |
-27.2 |
|
Increase/Decrease |
+2.1% |
+2.0% |
-19.7% |
-41.4% |
-27.2% |
-14.0% |
| All Rural Roads |
|
|
|
|
|
|
|
Billion VMT vs 2019 |
+1.8 |
+1.7 |
-13.7 |
-31.7 |
-19.6 |
-9.5 |
|
Increase/Decrease |
+2.5% |
+2.6% |
-17.1% |
-37.6% |
-22.4% |
-10.9% |
That data can be graphed visually like so:

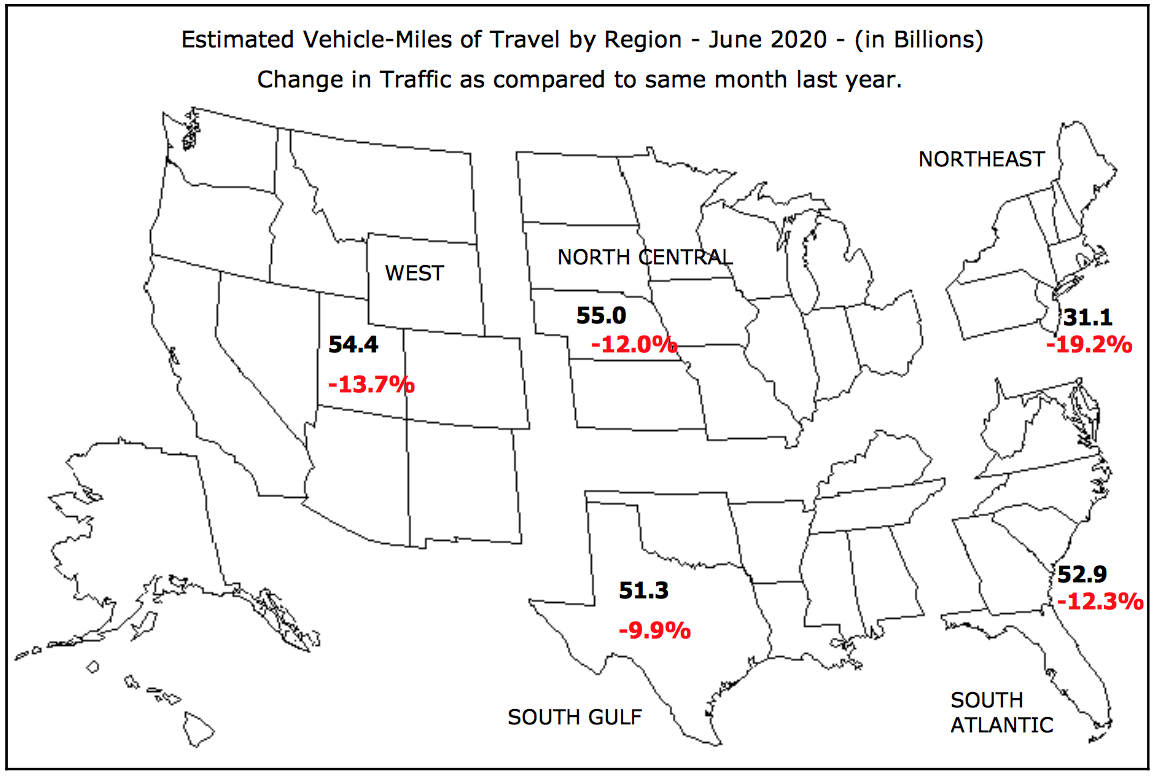
And there is regional variance as well, which FHWA is kind enough to map.


