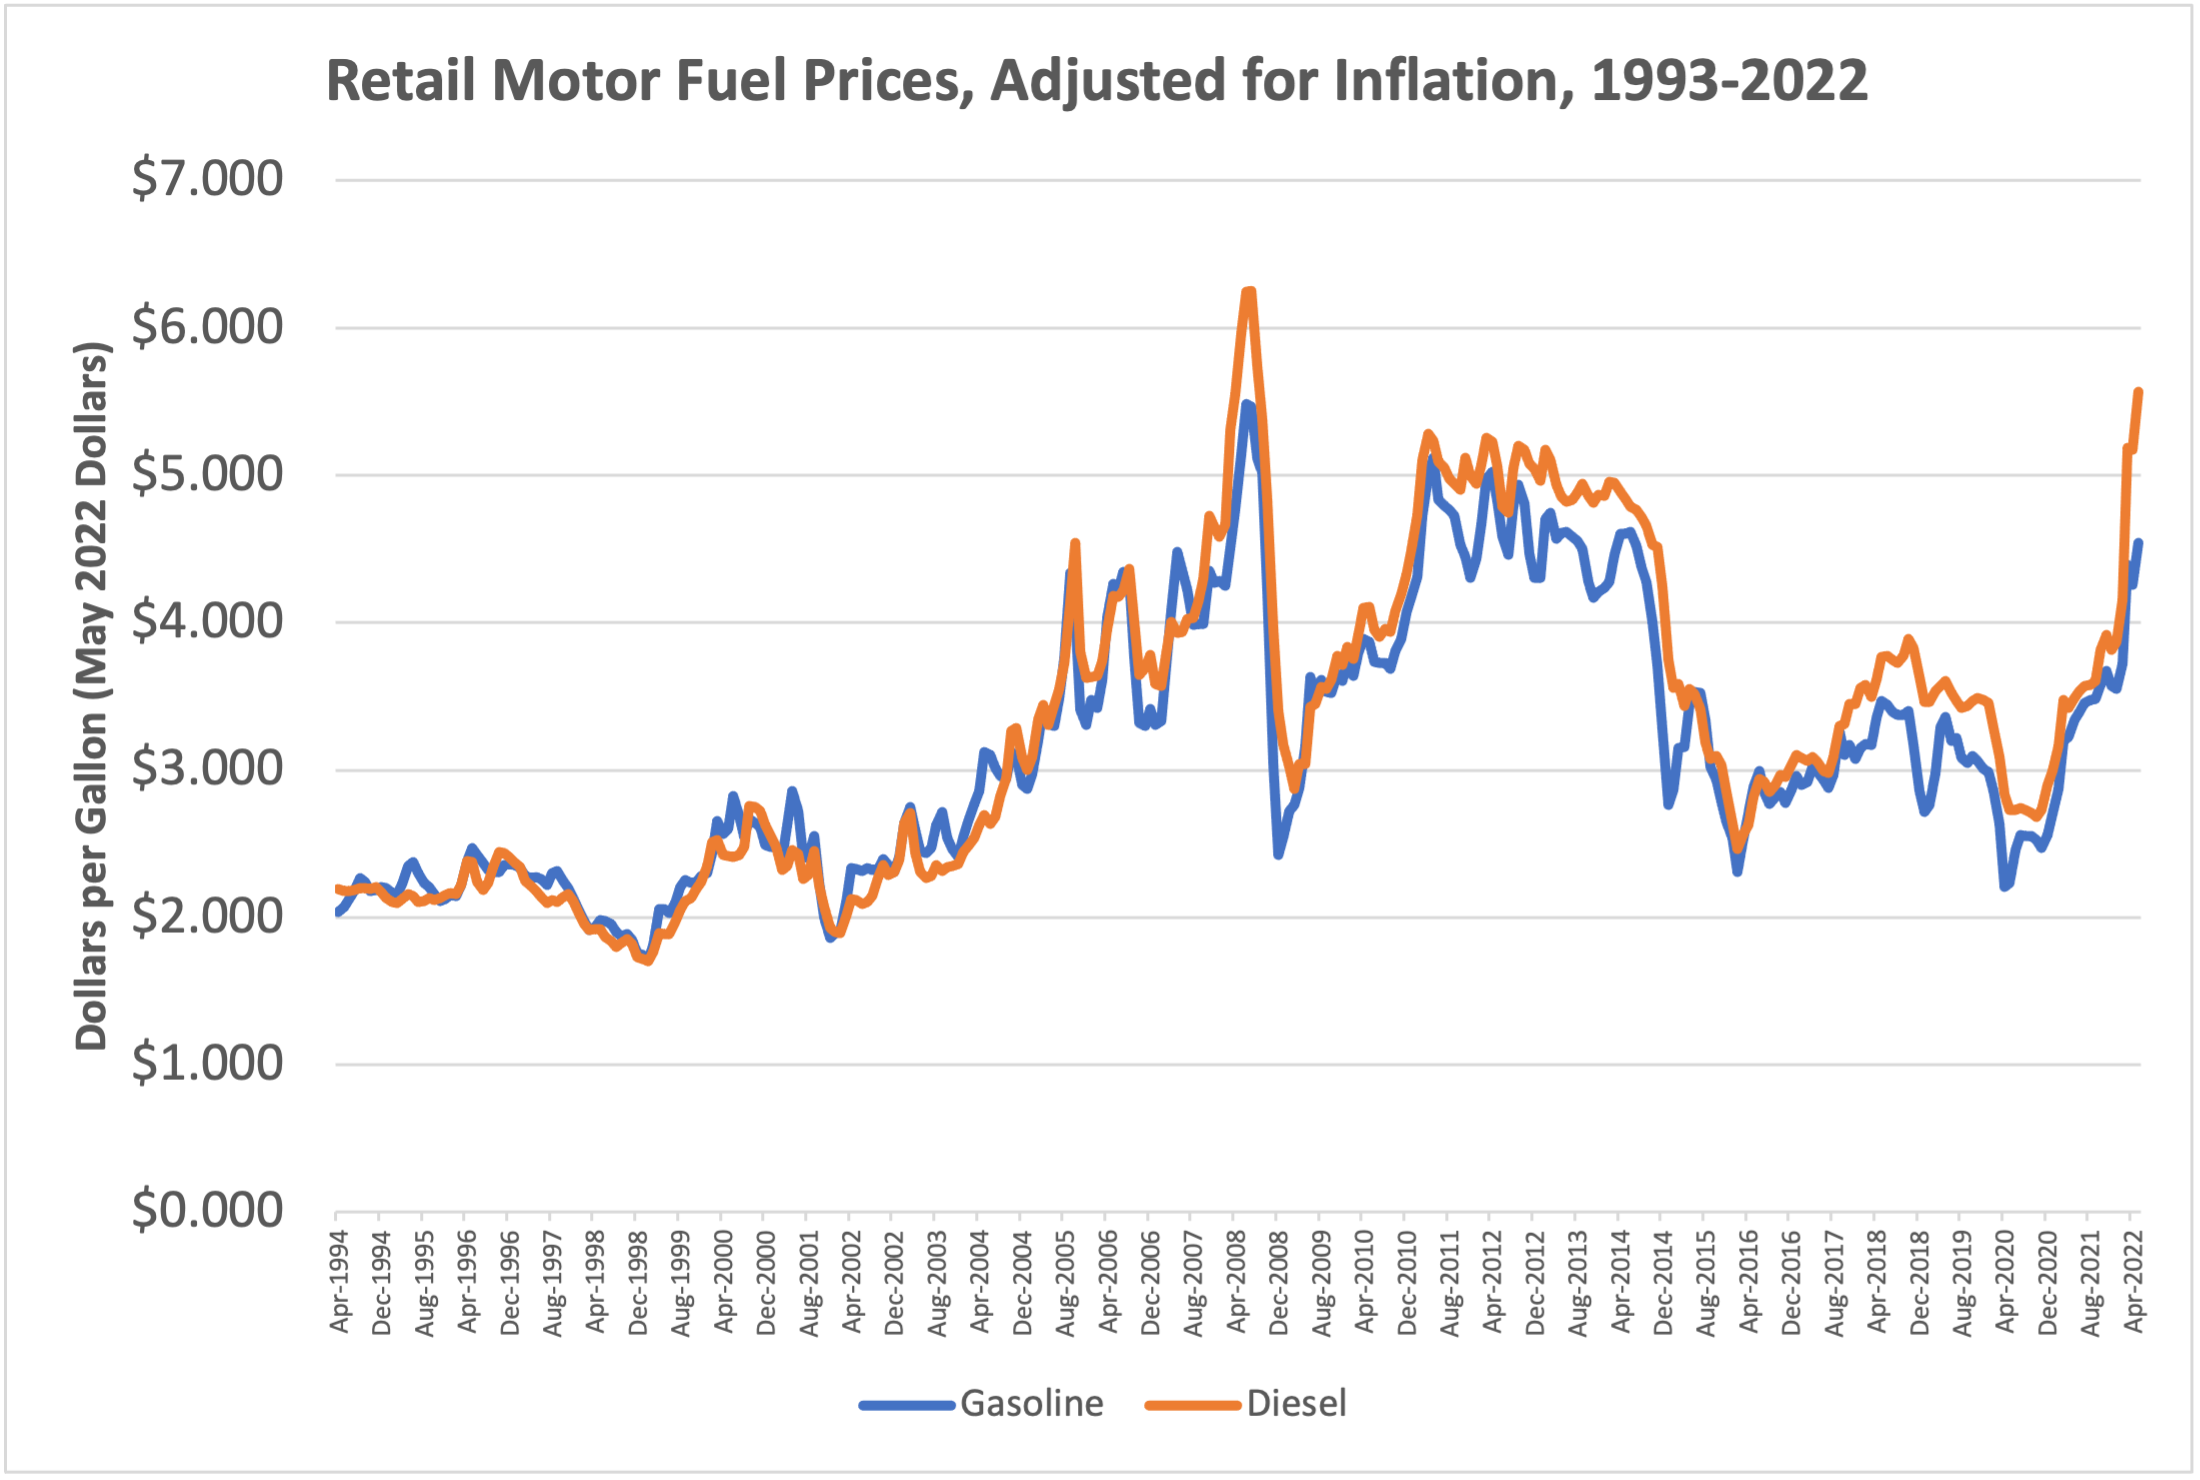
The U.S. Energy Information Administration reported this week that the average retail price of a gallon of gasoline rose to $4.55 on average in the month of May, and a gallon of diesel fuel cost $5.57.
Worse news: because prices were rising throughout the month, prices for the week ending June 6 were even higher – $4.98 per gallon on gasoline and $5.70 for diesel.
This morning, the Bureau of Labor Statistics released the monthly inflation report. (More bad news, with an annual rate, May 2022 over May 2021, of 8.6 percent, the highest since 1981). But some not-so-bad news, comparatively speaking, is buried in there.
Both the fuel price and inflation reporting websites allow Excel downloads of historical information, so one can cut-and-paste and use Consumer Price Index inflation to compare fuel prices, month-to-month, going back to 1994.
It turns out that, using CPI, we are on the verge of pushing through the most recent high-water mark for fuel prices, which was the summer of 2008.
First, the raw (nominal) data:
|
Gasoline |
Diesel |
CPI-U |
| June 2008 |
$4.105 |
$4.677 |
218.815 |
| July 2008 |
$4.114 |
$4.703 |
219.964 |
|
|
|
|
| May 2022 |
$4.545 |
$5.571 |
292.296 |
Then, re-base so May 2022 = 1.000 to find the inflation multiplier:
|
Nominal Price |
Multiplier |
Inflation-Adjusted Price |
|
Gasoline |
Diesel |
|
Gasoline |
Diesel |
| June 2008 |
$4.105 |
$4.677 |
1.336 |
$5.484 |
$6.248 |
| July 2008 |
$4.114 |
$4.703 |
1.329 |
$5.467 |
$6.250 |
|
|
|
|
|
|
| May 2022 |
$4.545 |
$5.571 |
1.000 |
$4.545 |
$5.571 |
As horrifying as it sounds, gasoline has another dollar per gallon to go (on a monthly average) before things get as bad as they were in 2008, this being the sad situation of our rapidly-debasing currency.
(It should be remembered that it was spring-summer 2008 when seasoned politicians who certainly knew better, like Hillary Clinton and John McCain, were falling all over themselves to endorse things like gas tax holidays in order to try and be seen as providing some relief to voters.)


