FTA Updates New Start Project Vitals; Inglewood, Silicon Valley Still Costly Outliers
As part of the rollout of President Biden’s fiscal 2025 budget request, the Federal Transit Administration (FTA) has updated the summary data for many of the projects in the Capital Investment Grant (CIG) program “pipeline,” which allows us to update our new favorite metric for judging the worthiness of these projects, capital cost per daily rider.
The following table shows the total capital cost, CIG program share of that cost, and estimated daily ridership for the planning “horizon year” (usually around 2040 for projects in this cycle). Not all projects currently in development have ridership estimates posted on the FTA website yet, so those projects are not listed. Dollar amounts are in millions.
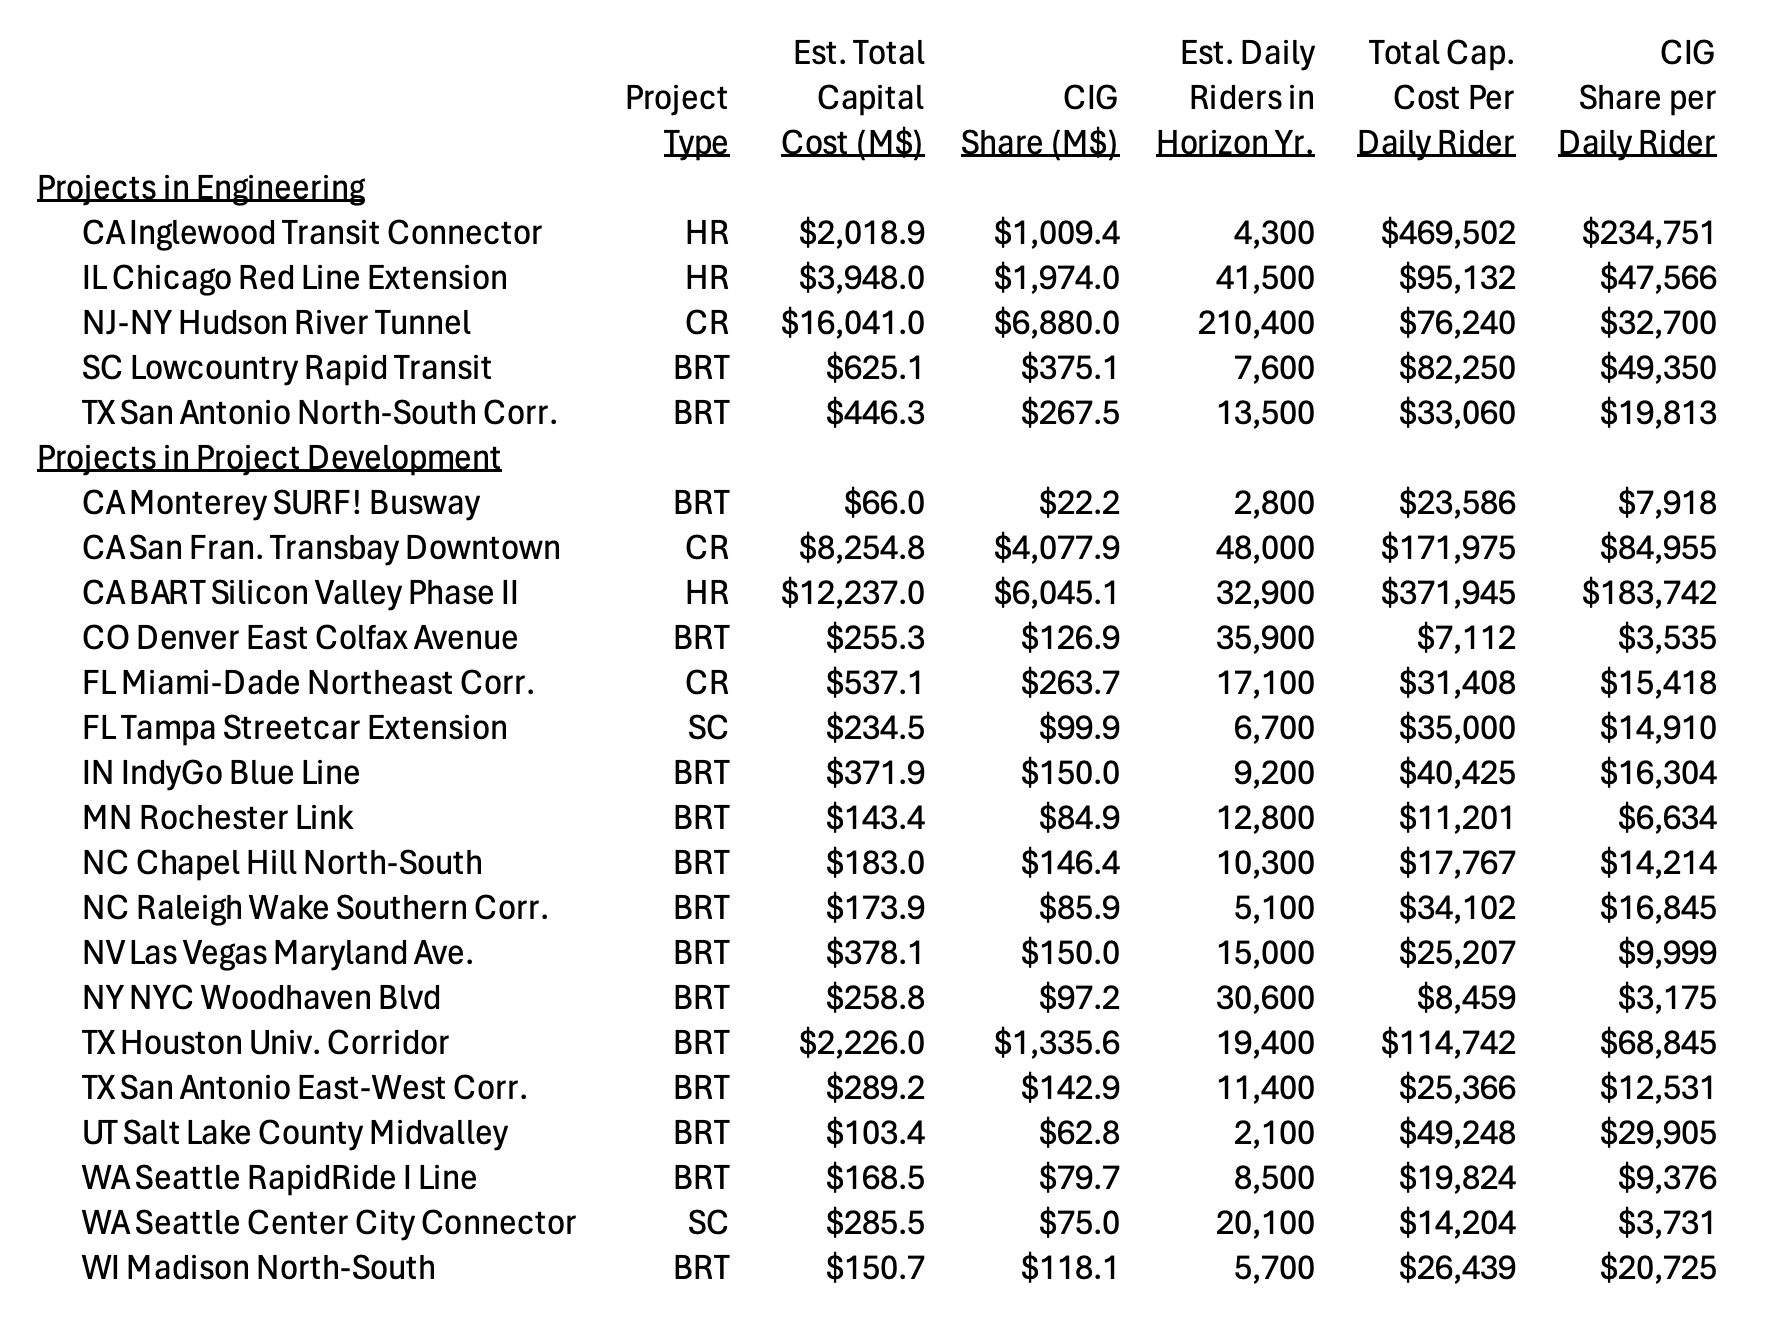
(BRT = Bus Rapid Transit; CR = Commuter Rail; HR = Heavy (Capacity) Rail; SC = Streetcar)
All of the projects listed in the table have their cost estimates and ridership projections taken from the updated project summaries on the FTA website. In the case of four projects (Silicon Valley Phase II, Las Vegas Maryland Avenue, Houston University Corridor, and Seattle RapidRide I Line), the cost estimates in the March 1, 2024 CIG Dashboard are more recent than those in the project summaries, so the Dashboard totals are used instead.
The clear outliers are in California, starting with the Inglewood Transit Connector, which weighs in at an astounding capital cost of $470 thousand per estimated daily rider in its horizon year of 2040, of which the FTA is being asked to pay $235 thousand per daily rider. A quick look at the map shows you why. The project is less about connecting underserved neighborhoods than it is about connecting the new Rams stadium and the adjacent office and entertainment complex, which includes National Football League headquarters (and will soon include the new Clippers arena) to the Metrorail system. Projects like this, which use public moneys to give benefit to private interests (in this case, Stan Kroenke and his wife, Ann Walton Kroenke (yes, those Waltons) own the Rams and co-own the stadium and the entertainment complex where Hollywood Park racetrack used to be, along with a private equity fund), always raise the question of how much of the money should be raised via value capture (making real estate interests pay a portion of the increased value of their real estate stemming from public improvements).
Inglewood has a separate problem. The project has been fast-tracked because of the 2028 Olympics. From the perspective of getting people to and from these Olympic venues, the project must be operational from July 14-30, 2028. From an Olympics POV, a transit project that is behind schedule, inoperational, and has the roads all torn up in July 2028 is worse than no new project at all. (In the absence of the new rail project, more bus service can always be jury-rigged by that point.) This is why the last sentence of the updated project summary is so important: “The [Inglewood Transit Connector Joint Powers Authority] anticipates receipt of a Full Funding Grant Agreement in 2024 and opening for revenue service in early 2030.”
The other major outlier is “Silicon Valley Phase II” – the extension of the San Francisco Bay area BART heavy rail system through San Jose into the city of Santa Clara. Heavy rail projects usually score well on per-rider cost metrics, because the “heavy” is short for “heavy capacity.” (Light rail, being the opposite of heavy capacity, usually scores poorly on per-rider cost, and by coincidence, there is not a single light rail project in the pipeline on the FTA website right now that has a both cost estimate and a ridership estimate.) The Hudson River Tunnel megaproject has a projected total capital cost of $16 billion, but at least it has tremendous throughput, and its estimated 210,400 daily riders in its planning horizon year averages out to a $76 thousand capital cost per rider.
The Silicon Valley project would cost three-fourths as much as the Hudson Tunnel ($12.2 billion), but would only carry about one-sixth as many daily riders (32,900), for a total capital cost of almost $372 thousand per daily rider. In addition, BART wants FTA to pay almost 50 percent of the capital cost in the form of a CIG grant, making the CIG share $184 thousand per daily rider.
By contrast, Denver has a proposed BRT project that would move slightly more people per day than Silicon Valley Phase II (35,900 pax/day vs 32,900) but would only cost 2 percent as much ($255.3 million vs $12.237 billion), for a total capital cost per daily rider of just over $7 thousand. (Not $372 thousand.) Bus projects, of course, don’t have the permanence of underground rail and thus don’t necessarily bring the transformational urban development changes over many decades that new subway stops do.
But this gets into the fundamental question that has persisted with the mass transit program since its inception in the 1960s: is the primary role of mass transit to move people from place to place in an efficient manner, or is the primary role of transit to help develop neighborhoods and cities? The question was supposedly answered in 1968 when mass transit was moved from HUD (where it started out) to DOT, but land use and development are still factors used in determining the relative worth of a proposed new transit project. Attention to per-rider capital cost as a metric can help distinguish between transit projects that are primarily about moving people efficiently versus transit projects of the same class that are more about real estate development.

