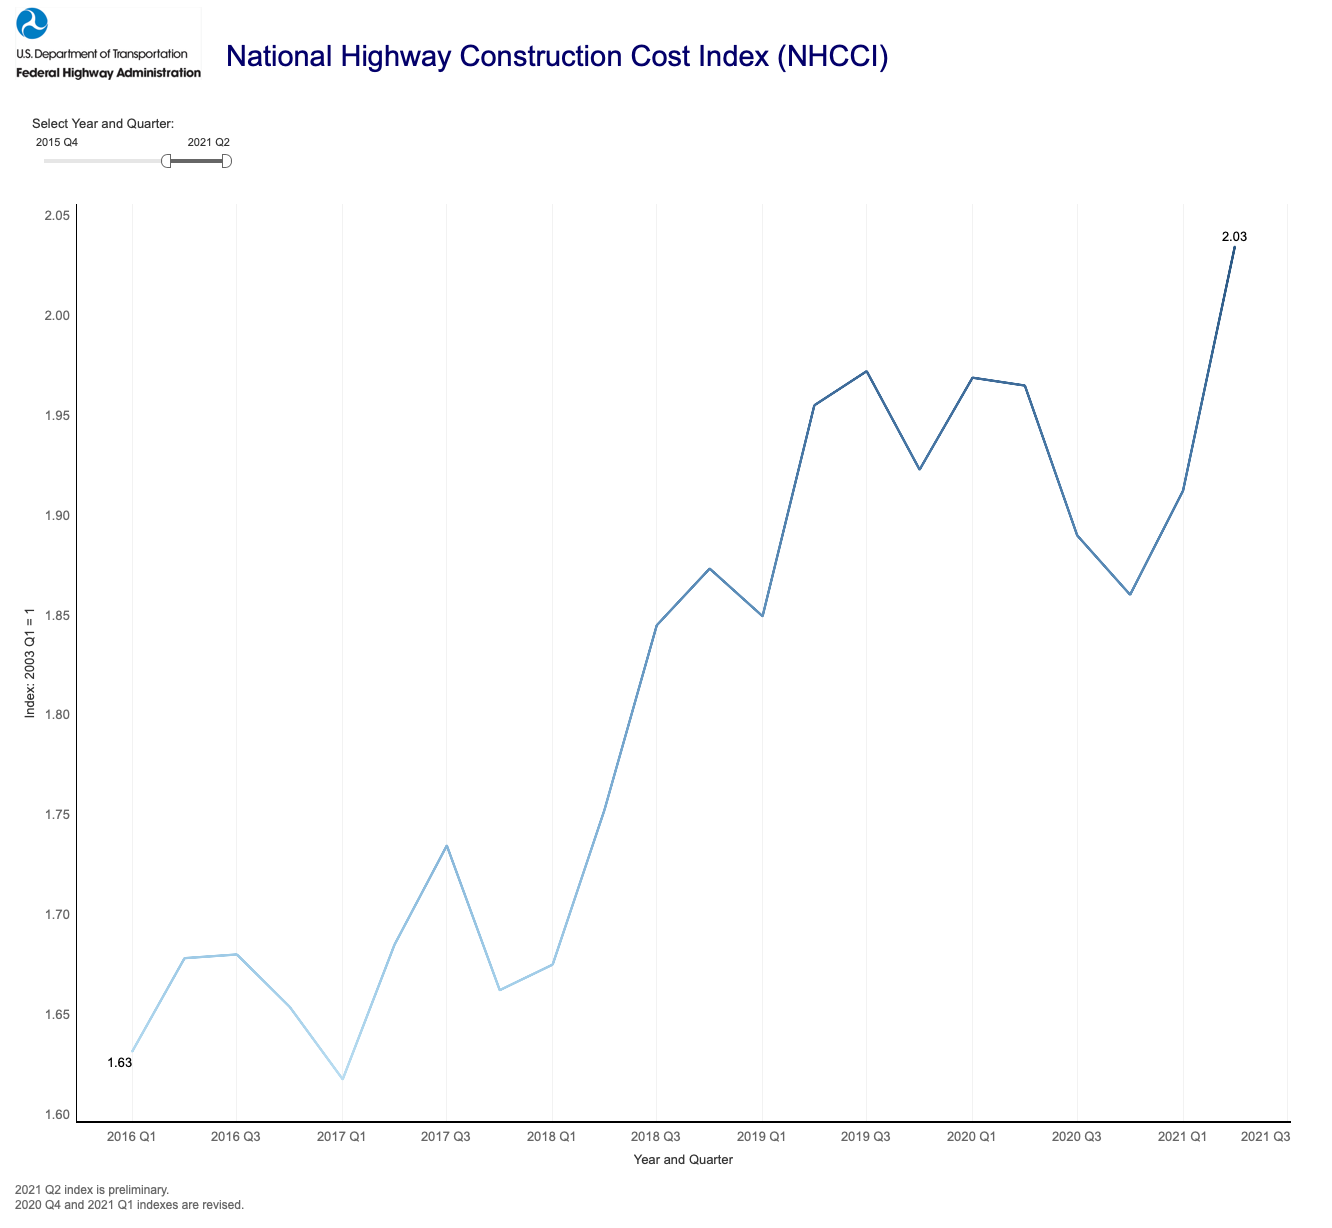
If you follow economic news, the last few weeks have seen unsettling signs of inflation. On February 10, it was announced that the Consumer Price Index (CPI) rose at an annualized rate of 7.5 percent in January, the highest rate since February 1982 (the tail end of The Great Inflation that lasted from the late 1960s to the end of 1982). Looking deeper, the Producer Price Index (PPI) for final demand was up an annualized 9.7 percent in January.
What does this mean for infrastructure construction?
While CPI is the most common inflation measure, it is a poor fit because it focuses on consumer costs like housing, food, cable TV bills, gym memberships, health care costs, pet care, etc. which are not the kind of things that governments spend a lot of infrastructure money to purchase. One can cobble together PPIs for a better look, but the Federal Highway Administration already keeps a measure for highways – the National Highway Construction Cost Index, or NHCCI.
Using recent experience, in the fourth quarter of calendar year 2015, when the FAST Act was signed into law, the NHCCI stood at 1.66. At present, the most recent data we have is the second quarter of 2021 (April-June 2021), when the NHCCI was 2.03, meaning that the cost of highway construction increased by 22.3 percent over that five-and-a-half-year period.

Meanwhile, outlays from the Highway Account of the federal Highway Trust Fund were $42.95 billion in fiscal year 2015 (which had just ended when the FAST Act was signed) and had risen to $48.27 billion in fiscal 2020, the last year of FAST. That is a $5.32 billion increase, or 12.4 percent, meaning that so far, all of the FAST Act’s highway funding increases have been more than eaten up by increases in highway construction costs (and then some).
(You may ask why I didn’t use fiscal year 2021 as the end point of the calculation, instead of FY 2020. The reason is that because of COVID and end-of-authorization uncertainty, Highway Account outlays dropped in FY 2021 to $45.72 billion and I thought that was a bit misleading.)
Much of the recent increase in the cost of construction is due to the increased price of asphalt, which is directly linked to the price of a barrel of crude oil. The other big increase is in the cost of excavation, which is partly due to oil prices (the diesel fuel that runs the heavy equipment) and partly due to the labor shortage (excavation is labor-intensive).
Oil prices rise and fall all the time, but once systemic inflation gets going, it affects everything. A while back, I wrote a two-part history of the epic struggle behind the 1978 highway act (part 1, part 2) and when doing the research, it was striking how much concern was expressed in Congress and the White House that increasing transportation funding might exacerbate inflation. I put together the data for Highway Trust Fund spending and compared them to the components of the NHCCI’s predecessor, the FHWA Bid Price Index.
Despite the fact that the 1973 and 1976 highway acts had provided funding increases, and the fact that the 1974 Budget Act’s abolition of presidential impoundment authority allowed states to spend all their pent-up carryover balances in 1976, spending from the Trust Fund was only 29 percent higher in fiscal 1978 than it had been in 1972. But over that same period, The Great Inflation had caused the price of excavation to more than double. Both asphalt and portland cement concrete had increased in price by around 85 percent, almost three times as much as highway spending had increased.
| Highway Construction Inflation in the 1970s |
|
Fed. HTF |
FHWA BPI Reported Cost Of: |
|
Outlays |
Excavation |
PC Concrete |
Asphalt |
Struc. Steel |
|
(Billion $) |
(cu. yd.) |
(sq.. yd.) |
(ton) |
(lb.) |
| 1972 |
$4.69 |
$0.72 |
$6.42 |
$9.23 |
$0.34 |
| 1973 |
$4.81 |
$0.80 |
$7.00 |
$10.02 |
$0.37 |
| 1974 |
$4.60 |
$1.00 |
$8.88 |
$14.74 |
$0.55 |
| 1975 |
$4.84 |
$1.03 |
$8.88 |
$15.13 |
$0.55 |
| 1976 |
$6.52 |
$1.03 |
$8.92 |
$14.83 |
$0.48 |
| 1977 |
$6.15 |
$1.16 |
$9.95 |
$15.47 |
$0.52 |
| 1978 |
$6.06 |
$1.54 |
$11.90 |
$17.16 |
$0.60 |
| 6-yr. Incr. |
+29% |
+114% |
+85% |
+86% |
+76% |
The lesson here is that, just as inflation means that households can afford to buy fewer goods and services with each paycheck, even if the paychecks increase here and there, inflation also means that governments will build fewer infrastructure projects for every million dollars they spend.


