With the dust finally settled from the 2022 midterm elections and new (as well as incumbent) elected officials sworn in over the country, we finally have an idea of how the legislative process will shape up over the next couple of years. The same can be roughly said for transportation policy, thanks to voters who also cast their ballot for hundreds of measures across the country.
The trend is not a new one. For at least the past 20 years, voters across the country regularly endorse a large share of the ballot measures for transportation projects. Ballot measures help support a wide variety of transportation investments, including roads and bridges, public transit, non-motorized projects for bicycles and pedestrians, and even air and seaports. They are supported by a wide variety of funding and finance options, especially sales and property taxes.
In the United States, ballot measures take the form of initiatives or referendums. They can be citizen-referred and placed on the ballot through the collection of voter signatures, for example. They can also be referred to voters by legislatures to address a discrete question or spending proposal, or else be part of state rules that require constituent approval for certain tax increases. All states allow for legislative referendums, but only twenty-four provide for citizen referendums.
Particularly in this time of partisan rancor and federal legislative gridlock, local initiatives and referendums hold great potential for pragmatic leaders and citizens interested in taking action on transportation.
For these reasons, Eno has tracked, catalogued, and analyzed the measures that appeared before voters in 2022.
Findings:
Eno analyzed 323 transportation measures this year, including 142 on Election Day. Just under half (19) of states recorded had ballot measures, the vast majority of which were on the local and county level but there were also two statewide measures. Ballot initiatives were most numerous in the South, followed by the West and Midwest, with the fewest occurring in the Northeast.
It is important to note that, in terms of the overall count, 56 percent of transportation-related measures were in just two places: Michigan and Ohio. These states require certain tax questions to go before voters, therefore routine property tax measures to generate revenue for local street maintenance are numerous in Michigan in August and in Ohio in November. These are usually quite small and overwhelmingly popular. Michigan voters approved 81 percent of this year’s local road questions; Ohio voters approved 96 percent of their local road questions. For this analysis, the local road questions in those states are kept separate.
Table 1: Total Amount of Transportation Measures and Dollar Amounts Considered by Voters, 2022
|
Total |
Pass |
Fail |
| Election Day |
142 |
106 |
33 |
| Michigan and Ohio local roads |
181 |
156 |
25 |
| Total for 2022 |
323 |
262 |
61 |
Overall, transportation was victorious at the ballot box and 75 percent of all measures outside of Ohio and Michigan passed (including Ohio and Michigan raises that success rate to 81 percent.) Compared to 2018’s 71 percent success rate for measures excluding Ohio and Michigan, transportation’s ballot box prospects seem to have improved.
However, upon closer examination, election night was a mixed bag for nearly all modes of transportation. Michigan passed fewer ballot measures on average, while Ohio surpassed its 2018 approval rate of transportation maintenance measures. Policy initiatives, such as Philadelphia’s aviation department or Manor County, TX’s decision to remain within the jurisdiction of Capital Metro, succeeded. However, some of the largest measures, such as California’s Proposition 30 and Orange County, FL’s multi-billion dollar transit proposal, failed.
Mode:
For the purposes of our analysis, we catalogued each ballot measure based on the primary mode of transportation identified in the measure’s language–in other words, which mode would receive the most funding as a result of the measure passing or which mode was otherwise at issue if money wasn’t being considered. Many funding measures identified other modes that would also benefit, but at a lower, and oftentimes unspecified, level. A measure was categorized as “multimodal” if the measure made it clear many modes would receive funding or if it was impossible to tell based on the measure’s language which modes would receive the bulk of the money.
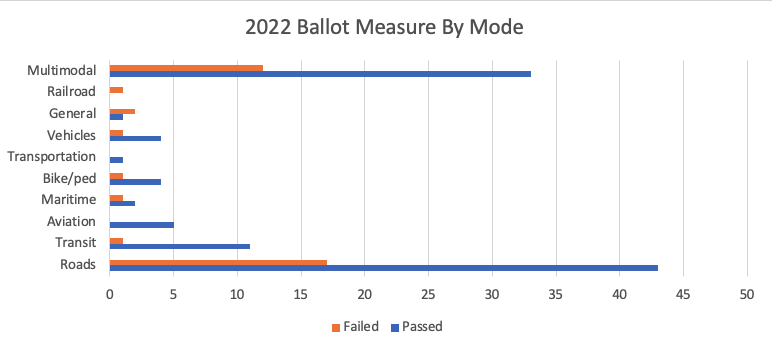
Voters approved far more ballot measures to raise money primarily for roads than for any other mode, passing 43 of the 60 ballot measures to raise money for roads – a 72 percent success rate. Again, this does not include the hundreds of local road millage renewals in Michigan and Ohio.

*Does not include Michigan and Ohio local road millages.
While there were more road measures on the ballot this year than any other mode, transit projects enjoyed a higher success rate – 92 percent. Multimodal measures had a 73 percent success rate, while bike/pedestrian measures had an 80 percent success rate.
Additionally, while more measures were approved for road funding than for any other mode, looking at the actual dollar amounts approved tells a different story. Voters approved far more money for multimodal and transit projects than for roads–for the simple reason that the average amount of money at stake in the multimodal and transit measures was far greater than the average in road measures. Again, the “multimodal” measures will also result in more money for transit, roads, and other modes, but at the time of this analysis it was unclear how much money will go to each.
Funding:

*Does not include Michigan and Ohio local road millages.
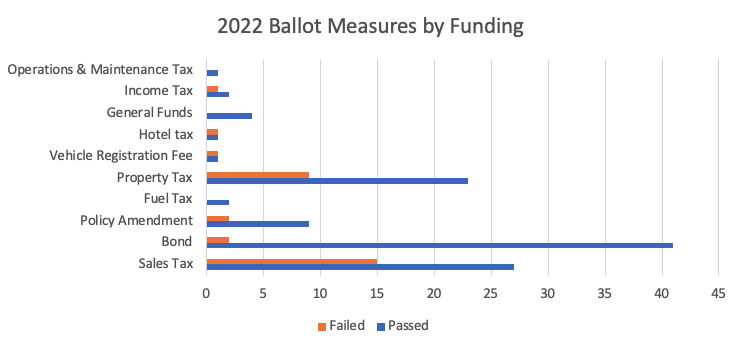
2022 featured a diverse cast of funding measures. Bonds (43 in total) had a 95 percent success rate, making it one of the most successful funding methods as well as the most numerous. Sales taxes were a close second (42 in total) in terms of popularity, but only had a 72 percent success rate. Property taxes were the third most popular overall (32), and had 72 percent success rate as well.
Although the three aforementioned types of funding methods were also popular in 2018, transportation bonds narrowly beat sales taxes as the most popular method for raising money in 2022.
A number of more specific funding methods also emerged as a part of the 2022 election. While a few only had roughly a 50 percent success rate (for example, hotel taxes and vehicle registration fees), others passed with flying colors. Both fuel taxes in Washington state and Carson City, NV passed in their respective jurisdictions, while use of general funds in four Wisconsin districts passed undefeated.
Takeaways:
Transportation ballot measures usually yield varying results over the years, but 2022 proved to be even more evasive than usual. Whereas in years past large ballot measures funded via sales taxes passed, such as Hillsborough County, FL in 2018, similar efforts failed in the same places. However, other states, such as Massachusetts, were able to pass large transportation ballot measures that will bring in billions in revenue over the next few years.
Much like the general election that gave the U.S. divided government, the 2022 transportation ballot measures produced a disparate set of circumstances for transportation agencies across the country.
No matter the outcome, Eno is committed to monitoring, cataloging, and analyzing transportation trends across the nation, and this year’s election was no exception. Make sure to stay tuned to Eno for any and all updates on transportation at the ballot box.
Database Methodology and Caveats
The transportation-related measures were identified from thousands of state and local ballot measures voters considered this year. It is usually not difficult to identify those that are specific to transportation, however different communities describe these investments differently.
Localities in California, for example, put forth numerous measures designed to fund a general set of local facilities and services. These include transportation elements like streets and sidewalk maintenance but also fire and police services and other local priorities. Sometimes details are available as to the funding breakdowns for those measures that include sectors beyond transportation—like San Jose’s Measure T. In those instances only the transportation-related revenue is included in this analysis.
If transportation was not identified as a significant or predominant focus of the measure, it was not included in the database. Also not included are measures to elect local officials to posts such as Road Commissioner or similar, nor are measures to raise revenue or decide issues related to school transportation.
It is occasionally difficult to determine the total amount of funding voters approved because some measures are ongoing, or continuing in perpetuity. In those cases, the annual amount raised is multiplied by 20 years to determine a “total.” As noted, reporting on measures that issue debt in the form of bonds and combining that with measures that rely in a sales tax, for example, may be suspect. Those measures are included here, however, because that is how they are presented to voters and the “revenue” must be repaid through some other source. It is the voters’ sentiment to make such investments that we endeavored to capture.
In identifying relevant measures, we relied principally on information gathered directly from state and local boards of elections, officials, local and regional media, and specialty websites like Ballotpedia. The media report on large measures and there is usually considerable information about each. Small, local, and routine measures are difficult to uncover and even more challenging to determine their details such as length and amount raised.
Eno’s ballot measure database will be updated should we learn about any additional measures not included here. To contribute measures, please email publicaffairs@enotrans.org.
The Eno Center for Transportation does not endorse or oppose any of the measures in this document. The information is provided for research purposes only.


