$487 Million in TIGER Grants for FY 2017 Announced
March 9, 2018
Today, the U.S. Department of Transportation announced the 41 recipients of $487 million in total grant funding for the TIGER surface transportation grant program for fiscal year 2017.
Click here for our downloadable PDF analysis including tables ranking this year’s winners by grant size and federal share, separating them by transportation mode and by the rural-urban divide, and showing each state’s dollar amount and share of all TIGER grants from FY 2009-2017. An alphabetical list by state is also at the end of this article (just keep scrolling down). The list of project fact sheets from USDOT is here.
“TIGER grants are targeted investments for our local communities that will increase safety, create jobs and modernize our country’s infrastructure,” said Secretary Elaine L. Chao.
These are the Trump Administration’s first TIGER grants, and the list reveals some major differences in selection process compared to the Obama Administration.
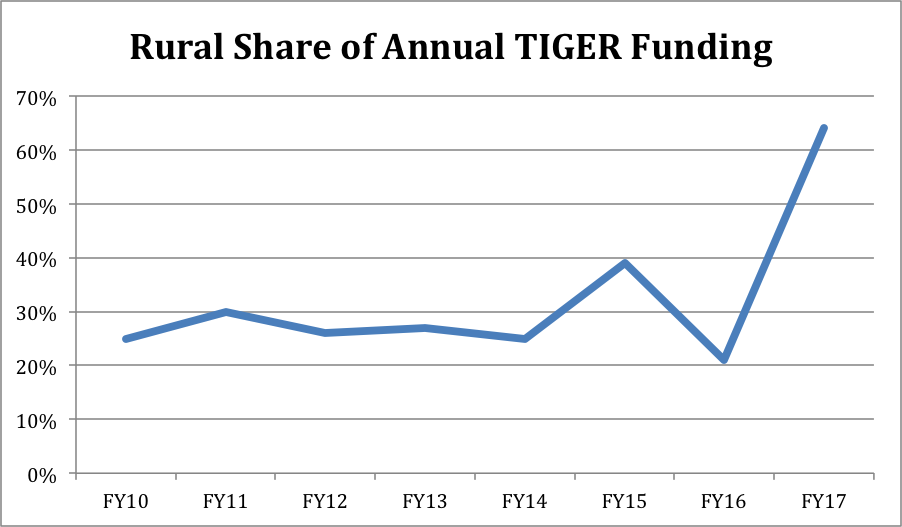
Rural preference. The 2017 appropriations law required a minimum of 20 percent of the grant money to go to projects in rural areas. But that was a floor, not a ceiling. The Trump Administration sent 64 percent of the FY17 TIGER grant money to rural projects. The Obama Administration, with one exception in 2015, kept the rural share much closer to the 20 percent minimum. (The first round of TIGER grants in 2009 did not distinguish urban projects from rural projects.)
This is such a big deal that it is worth noting the TIGER definition of “rural” from the FY17 application FAQ document:
The TIGER Grant Program defines “rural area” as any area outside an Urbanized Area (UA) as designated by the U.S. Census Bureau. Per the Census Bureau, a UA is an area that consists of densely settled territory with a population of 50,000 or more people.
The Department will consider a project to be in a rural area if most or all of the project (determined by geographic location(s) where the majority of money is to be spent) is located in a rural area (outside a UA).
Only one project per state. The Trump Administration selected 41 TIGER projects, for grantees in 41 states. This is a major change from the Obama Administration, under which larger states like California and New York often got multiple projects each year. Last year, for example, the Golden State got four TIGER grants, and two years ago the Empire State got three. (Two of the FY 2017 TIGER grants are for bridges across state lines, so even though the Wabash River Bridge money goes entirely to Indiana DOT, the bridge goes to Illinois as well, arguably making Illinois the only state with the benefits of two projects this year.) Going one-per-state is one way to address the vague geographical diversity requirement in the appropriations law fudging the TIGER program.
This one-project-per-state rule has led to several states seeing their shares of total TIGER funding in 2017 drop drastically from their state average shares over the 2009-2016 period.
| FY09-16 | FY17 | |
| State | Share | Share |
| California | 8.1% | 1.8% |
| Illinois | 6.5% | 2.6% |
| New York | 5.7% | 0.4% |
| Massachusetts | 3.1% | 0.0% |
| Washington | 4.8% | 1.9% |
Not much for the Northeast this year. We organized this year’s TIGER grant recipients by Census region and division and found that the Northeast region only got 15 percent of the money, with the Midwest getting 21 percent, the West getting 27 percent, and the South getting 37 percent.
| Region | Division | Number | Total Grants |
| Northeast | New England | 3 projects | $40.8 million |
| Northeast | Middle Atlantic | 3 projects | $32.3 million |
| Subtotal, Northeast Region | 6 projects | $73.1 million | |
| South | South Atlantic | 7 projects | $110.9 million |
| South | East South Central | 3 projects | $27.7 million |
| South | West South Central | 4 projects | $40.8 million |
| Subtotal, South Region | 14 projects | $179.4 million | |
| Midwest | East North Central | 5 projects | $33.6 million |
| Midwest | West North Central | 4 projects | $69.0 million |
| Subtotal, Midwest Region | 9 projects | $102.6 million | |
| West | Mountain | 8 projects | $95.7 million |
| West | Pacific | 4 projects | $36.3 million |
| Subtotal, West Region | 12 projects | $132.0 million | |
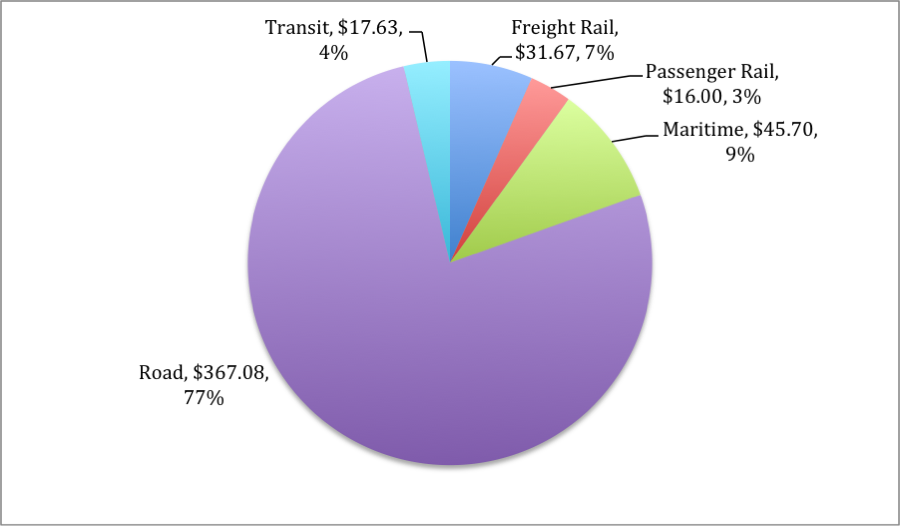
Almost nothing for mass transit. This year, only two mass transit projects were selected for TIGER grants, and their $17.6 million was just 3.6 percent of the total TIGER grant money. This is a sharp departure from the Obama Administration – two years ago, they gave 29 percent of the FY 2015 TIGER money to mass transit projects, and although their announcement for the FY 2016 grants did not break projects down by mode, we figure about 24 percent of that money went to transit projects.
Road projects got 77 percent of the 2017 TIGER money, up from 30 percent in 2015. Bike/ped projects, which got 7 percent of the money in 2015, received zero this year (though the Trump Administration did fund some “complete streets” initiatives that do have bike/ped components). Befitting Secretary Chao’s background in the maritime field, 9 percent of the 2017 TIGER money goes to port projects.
It’s still good to be on the right committees. As usual, the chairmen and ranking minority members of the appropriations subcommittees that actually provided the TIGER funding received grants in their states or districts this year. When 41 out of the 50 states got TIGER grants, this means that 82 of the 100 Senators got a grant, so it’s more unusual for a Senator not to have one than to have one. But 41 grants don’t go very far across 435 U.S. House districts, making their grants stand out more.
| Transportation-HUD Appropriations | |||
| House | |||
| Mario Diaz-Balart (FL), chairman | $13,132,691 | ||
| David Price (NC), ranking | $19,900,000 | ||
| Senate | |||
| Susan Collins (ME), chairman | $10,836,220 | ||
| Jack Reed (RI), ranking | $20,000,000 | ||
Well-placed Senators were also rewarded by the size and federal share of their grants. Two of the five largest grants this year were in the home states of Senate Commerce Committee chairman John Thune (R-SD, $21 million) and Surface Transportation Subcommittee chairman Deb Fischer (R-NE, $25 million). And Thune’s projects, which is on Indian land, is only one of two projects this year where the TIGER grant pays 100 percent of the cost. (Only four projects have TIGER cost shares above 80 percent.) And FYI, Fischer’s $25 million is only 9 percent of the $288 million total cost of that project, near the bottom of the list.
(Ed. Note: A look at our table that ranked the FY17 winners by TIGER share of project cost also points out how badly California got it this year. The lowest TIGER share of any project this year is the sole California projects, which got $9 million towards a $114 million road project (8 percent) in Modesto. Modesto!)
Career staff opinion still matters. The TIGER program each year receives hundreds more applications than can be funded. The career staff at USDOT analyze each application and then give each one a rating – “Highly Recommended,” “Recommended,” “Acceptable” or “Not Acceptable” – but there is no law saying that the political appointees at DOT who make the final decisions can’t fund projects that don’t get passing recommendations from the career staff.
All of the recipients of grants this year were from the projects given ratings of “Highly Recommended” or “Recommended.” (There may have been some consideration of giving grants to one or two “Acceptable” projects when none of the projects in the state that year rated higher than that, but in the end, DOT did not go that way.)
28 of the 41 grant recipients were from the “Highly Recommended” list, totaling $334 million. The other 13 projects were from the “Recommended” list, totaling $153 million.
Benefit-cost analysis was generally good. The TIGER funding notice required each applicant to submit an economic benefit-cost analysis (BCA) with the application in conformance with DOT guidelines. BCA analysis then gets distilled into a single number. If that number is greater than 1.0 then the benefits are greater than the cost, and if the number is less than 1.0, the project’s costs outweigh its benefits.
Only four of the 41 projects selected in 2017 has negative BCA’s. However, three of those four were among the largest grant winners this year – the Lincoln, NE South Beltway ($25 million), the Loudon County, VA Northstar Boulevard Missing Link ($25 million), and the Lower Brule Reservation BIA Highway 10 project in South Dakota ($21 million).
The list of grant recipients is below and remember to click on the link at the top of this article to access the full set of tables in PDF format.
FY 2017 TIGER Grant Recipients (Alphabetical)
| State | Location | Project Name | Project Type | Grant Size |
| AL | Port of Mobile | Southeast Automotive Gateway | Maritime | $12,700,000 |
| AK | Nelson Island | NATIVE multimodal trails project | Road | $10,176,835 |
| AR | Fort Smith | Ozark Multimodal Freight Corridors | Freight Rail | $8,527,892 |
| AZ | Nogales | SR 189 Truck Grade Separation | Road | $25,000,000 |
| CA | Modesto | Rte 132 Gateway Express Phase 1 | Road | $9,000,000 |
| CO | Ute Mountain Reservation | U.S. 160 upgrades | Road | $2,000,000 |
| DE | Sussex County | Georgetown East Gateway | Road | $7,000,000 |
| FL | Collier County | Immokalee Complete Streets | Road | $13,132,691 |
| GA | Atlanta | MARTA Summerhill BRT | Transit | $12,629,760 |
| IA | Burlington | Downtown/Riverfront Revitalization | Road | $17,000,000 |
| ID | Clearwater County | Jaype-Lewiston rail line repair | Freight Rail | $3,240,960 |
| IL | Williamson & Johnson Counties | Interstate 57 safety | Road | $7,600,000 |
| IN-IL | Lehigh County, IN | Wabash River rail bridge | Freight Rail | $10,000,000 |
| KY | Frankfort | Frankfort 2nd Street Corridor | Road | $7,990,000 |
| LA | Chalmette | Chalmette Slip Project reconstruction | Maritime | $13,000,000 |
| MD | Sparrows Point | Mid-Atlantic Multimodal Hub | Maritime | $20,000,000 |
| ME | Piscataquis & Penobscot Counties | Penquis Region rural bridges | Road | $10,836,220 |
| MI | Oakland County | North Holly Road | Road | $3,000,000 |
| MS | Starkville | Hightower Road Corridor | Road | $7,000,000 |
| MT | Gallatin County | MT 64 Rural Commuter Corridor | Road | $10,292,000 |
| NC | Raleigh | Blue Ridge Road grade separation | Road | $19,900,000 |
| ND | Turtle Mountain Reservation | Jack Rabbit Road Reconstruction | Road | $6,000,000 |
| NE | Lincoln | Lincoln South Beltway | Road | $25,000,000 |
| NH-VT | Lebanon, NH | I-89 Bridge to Hartford, Vermont | Road | $10,000,000 |
| NJ | North Bergen | Route 3 , Ramp A | Road | $18,260,000 |
| NM | Colfax County | Southwest Chief stabiliztaion | Passenger Rail | $16,000,000 |
| NV | Carson City | South Carson St. Complete Streets | Road | $7,570,202 |
| NY | Ogdensburg | Ogdensburg-Prescott Bridge | Road | $2,000,000 |
| OH | Akron | Downtown Akron Promenade, Phase 2 | Road | $8,000,743 |
| OK | Western Oklahoma | High Plains Strategic Freight Rail | Freight Rail | $9,901,793 |
| OR | Mill City | Mill City Downtown Restoration | Road | $8,082,574 |
| PA | Philadelphia | Schulykill River Trail | Road | $12,000,000 |
| RI | Cranston-Warwick | Route 37 Corridor Safety Sweep | Road | $20,000,000 |
| SC | Summerville-St. George | US 78 Phase 2 Bridge Improvements | Road | $13,250,000 |
| SD | Lower Brule Sioux | BIA Highway 10 Reconstruction | Road | $21,000,000 |
| TX | Houston | Roadway Flood Warning System | Road | $9,370,000 |
| UT | Millard County | Baker Canyon/Dog Valley Climbing Lanes | Road | $15,000,000 |
| VA | Loudon County | Northstar Boulevard Missing Link | Road | $25,000,000 |
| WA | Spokane Valley | Barker Road Grade Separation | Road | $9,020,149 |
| WI | Eau Claire | Chippewa Valley Regional Transit Center | Transit | $5,000,000 |
| WY | Park County | Beartooth Highway Reconstruction | Road | $16,600,000 |
| Total TIGER Grants | $487,081,819 | |||

